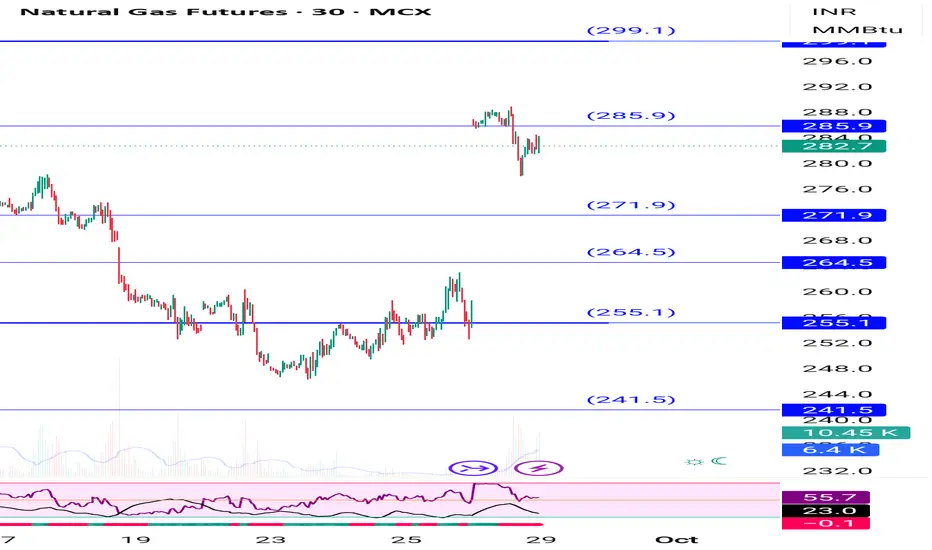
Natural gas 268-260 dip possible then buy upside 295-302 target Natural gas updated levels given on chart initially 268-260 fall possible then buy upside 295-302 upside short term target for next 2 -3 weeks
How My Harmonic pattern projection Indicator work is explained below :
Recent High or Low :
D-0% is our recent low or high
Profit booking zone ( Early
Natural Gas Futures
Sorry, this is only available to registered users
MCX provides data to our registered users only, so to get it you'll need to sign up for a TradingView account.
Contract highlights
Related commodities
Natural gas 302 target hit then some dip , again buy on dip 290Natural gas 302 target hit buy recommended near 280 , again buy near 290
How My Harmonic pattern projection Indicator work is explained below :
Recent High or Low :
D-0% is our recent low or high
Profit booking zone ( Early / Risky entry) : D 12.3% -D 16.1 % is
range if break them profit b
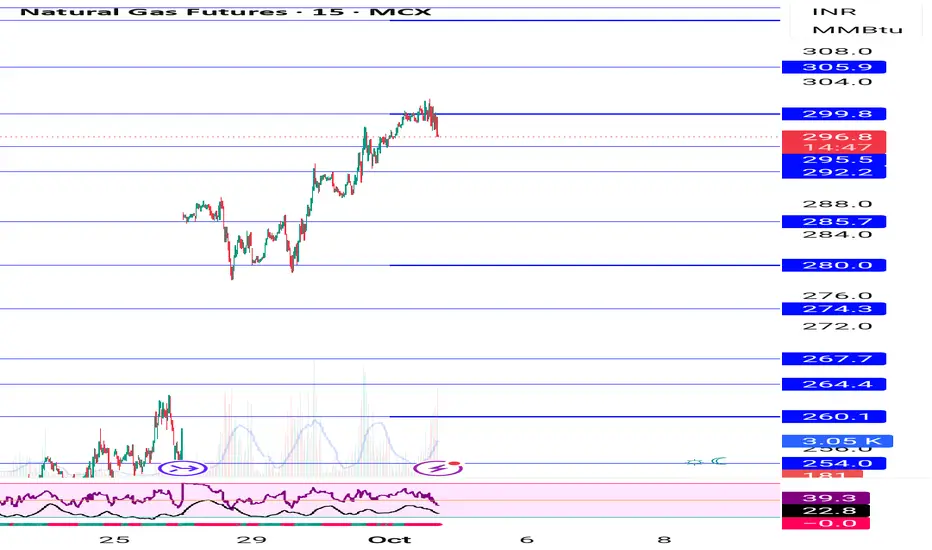
natural gas natural gas moving toward forward not ideal place to buy buy option near 295-298 . trg upto 352
sl 272 .
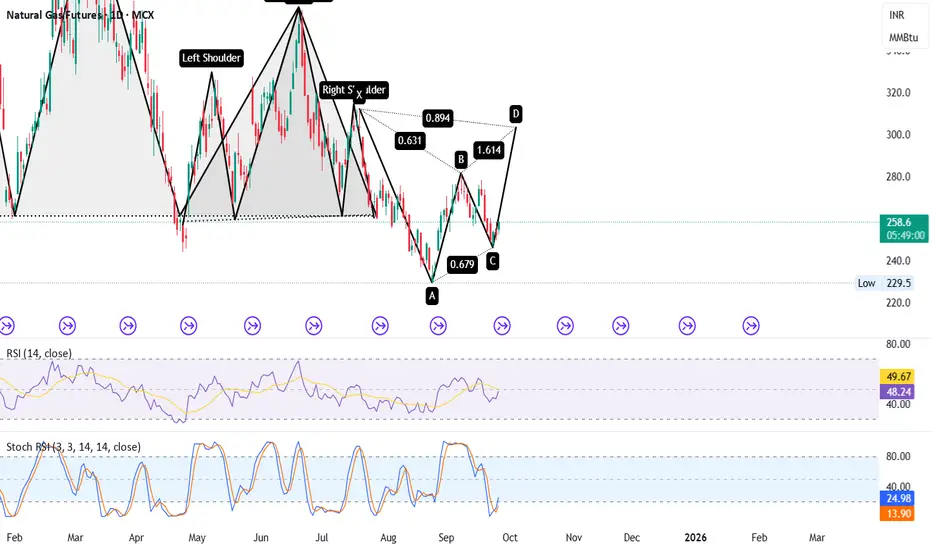
Natural Gas – Potential Bullish Reversal-304🔍 Key Highlights:
✅ XABCD Pattern Completion Zone:
XA to AB = 0.631 retracement
BC = 0.679 retracement
CD = 1.614 extension (projected move towards Point D)
✅ Bullish Structure in Progress:
Hidden Inverse Head & Shoulder supports bullish reversal
Confluence near Point C, increasing probabilit
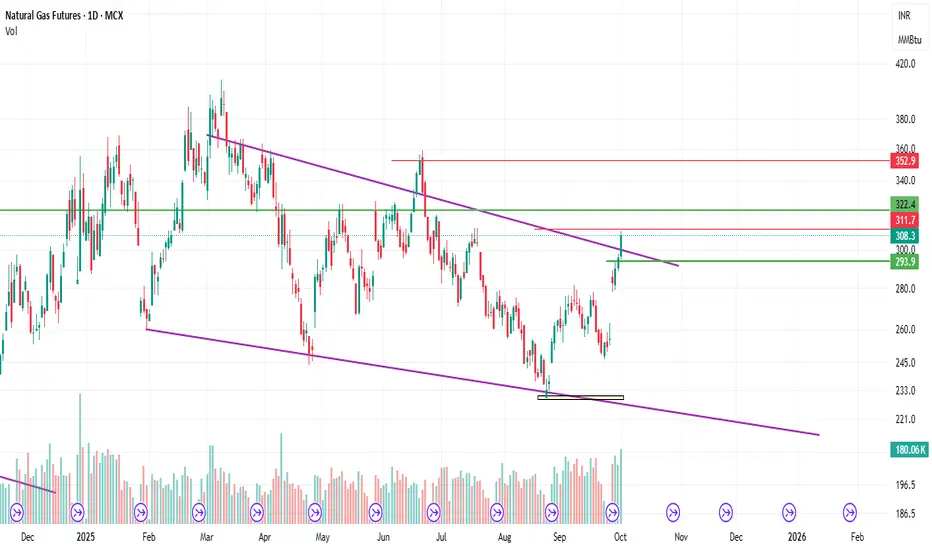
NaturalGas looks bullishNaguralGas completed its second wave correction and expecting that it will show 3.680 (nearly).

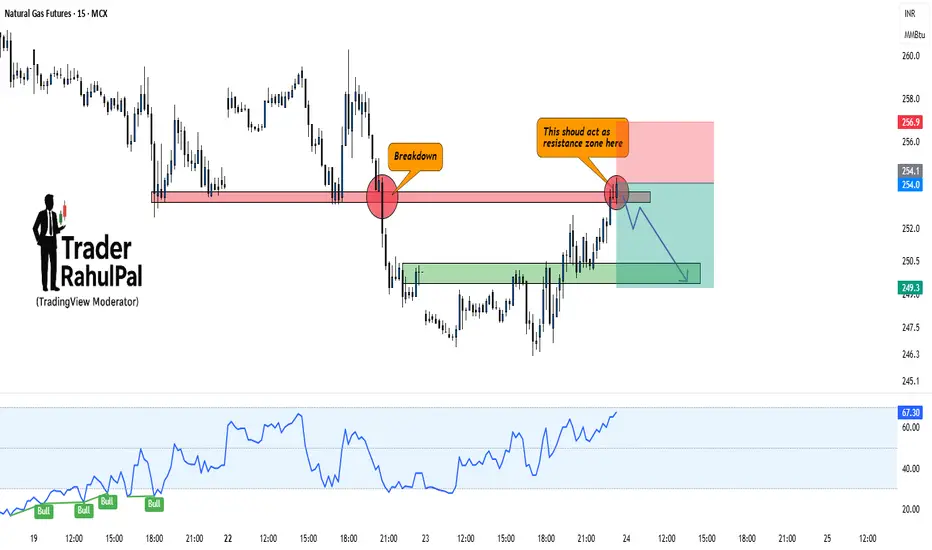
Natural Gas – Breakdown Retest Could Trigger Fresh FallHello everyone, Let's analyse Natural Gas and it has recently broken down from a key support level, turning it into resistance. The price is now retesting that zone, and unless bulls manage to reclaim it strongly, the downside remains the higher probability.
Current Setup:
Previous support arou
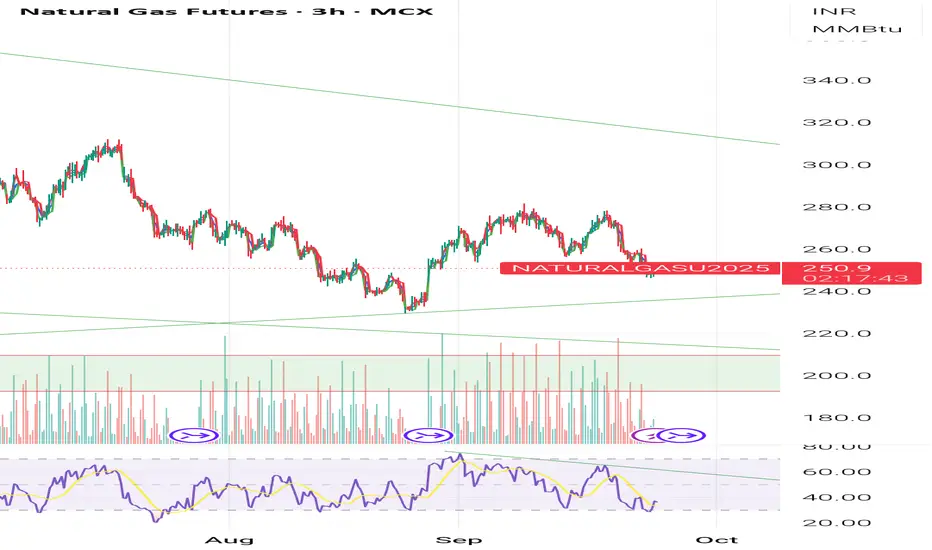
Natural Gas My last analysis about natural Gas was failed now it is in no trade zone , update you soon as I will see a trade opportunity.
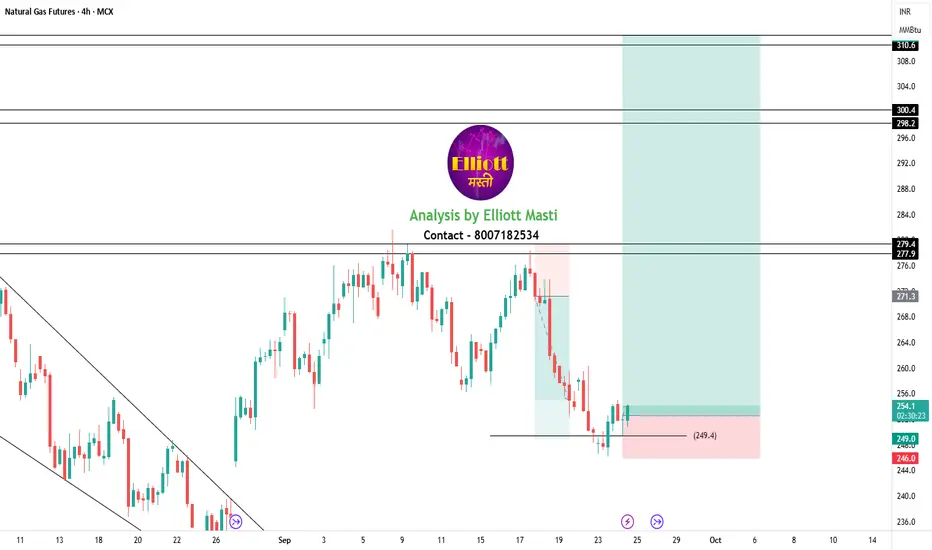
Natural Gas longWe can plan natural Gas long position for a short term with very small Stoploss and small target
But risk reward ratio is high
Disclaimer; for education purpose only

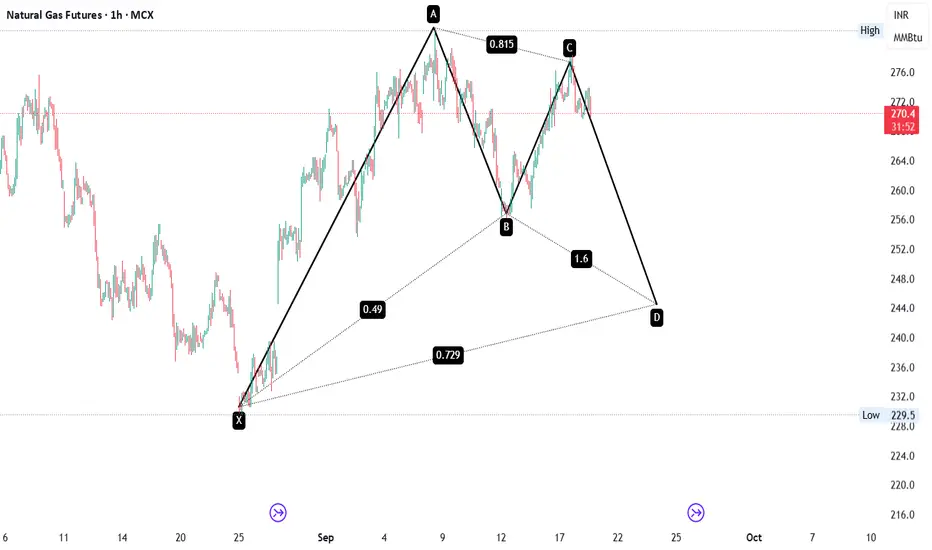
NATURAL GAS HARMONIC PATTERN
📈 Chart Pattern: Bearish Harmonic (Possibly Bearish Bat or Gartley Variant)
⚠️ Price Structure Breakdown:
A clean XABCD Harmonic Pattern is visible on the 1H timeframe:
🔹 XA Leg: Sharp impulsive rally from ₹229 → ₹281
🔹 AB Leg: Pullback retraced 49% of XA
🔹 BC Leg: Strong recovery to 81.5% of AB
See all ideas
A representation of what an asset is worth today and what the market thinks it will be worth in the future.
Sorry, this is only available to registered users
MCX provides data to our registered users only, so to get it you'll need to sign up for a TradingView account.
Displays a symbol's price movements over previous years to identify recurring trends.
Frequently Asked Questions
The nearest expiration date for Natural Gas Futures is Nov 24, 2020.
Traders prefer to sell futures contracts when they've already made money on the investment, but still have plenty of time left before the expiration date. Thus, many consider it a good option to sell Natural Gas Futures before Nov 24, 2020.