Natural gas maximum downside done start buy on dip near low Natural gas start buying on dip near recent low SL 155- upside 280-295, 310
How My Harmonic pattern projection Indicator work is explained below :
Recent High or Low :
D-0% is our recent low or high
Profit booking zone ( Early / Risky entry) : D 13.2% -D 16.1 % is
range if break them profit booking start on uptrend or downtrend but only profit booking, trend not changed
SL reversal zone (Safe entry ) : SL 23.1% and SL 25.5% is reversal zone if break then trend reverse and we can take reverse trade
Target : T1, T2, T3, T4 and .
Are our Target zone
Any Upside or downside level will activate only if break 1st level then 2nd will be active if break 2nd then 3rd will be active.
Total we have 7 important level which are support and resistance area
Until , 16% not break uptrend will continue if break then profit booking will start.
If break 25% then fresh downtrend will start then T1, T2,T3 will activate
1,3,5,10,15,20 minutes are short term levels.
30 minutes 60 minutes , 2 hours,3 hours, ... 1 day and 1 week chart positional and long term levels
Trade ideas

Natural gas bounce possible from current price limited fall leftNatural gas will take support near 270-265 avoid sell at current price
How My Harmonic pattern projection Indicator work is explained below :
Recent High or Low :
D-0% is our recent low or high
Profit booking zone ( Early / Risky entry) : D 13.2% -D 16.1 % is
range if break them profit booking start on uptrend or downtrend but only profit booking, trend not changed
SL reversal zone (Safe entry ) : SL 23.1% and SL 25.5% is reversal zone if break then trend reverse and we can take reverse trade
Target : T1, T2, T3, T4 and .
Are our Target zone
Any Upside or downside level will activate only if break 1st level then 2nd will be active if break 2nd then 3rd will be active.
Total we have 7 important level which are support and resistance area
Until , 16% not break uptrend will continue if break then profit booking will start.
If break 25% then fresh downtrend will start then T1, T2,T3 will activate
1,3,5,10,15,20 minutes are short term levels.
30 minutes 60 minutes , 2 hours,3 hours, ... 1 day and 1 week chart positional and long term levels
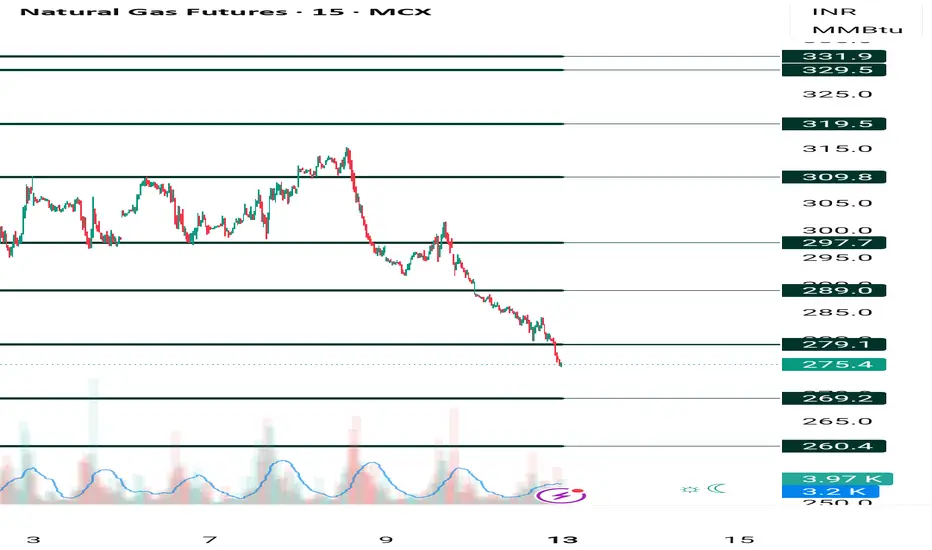
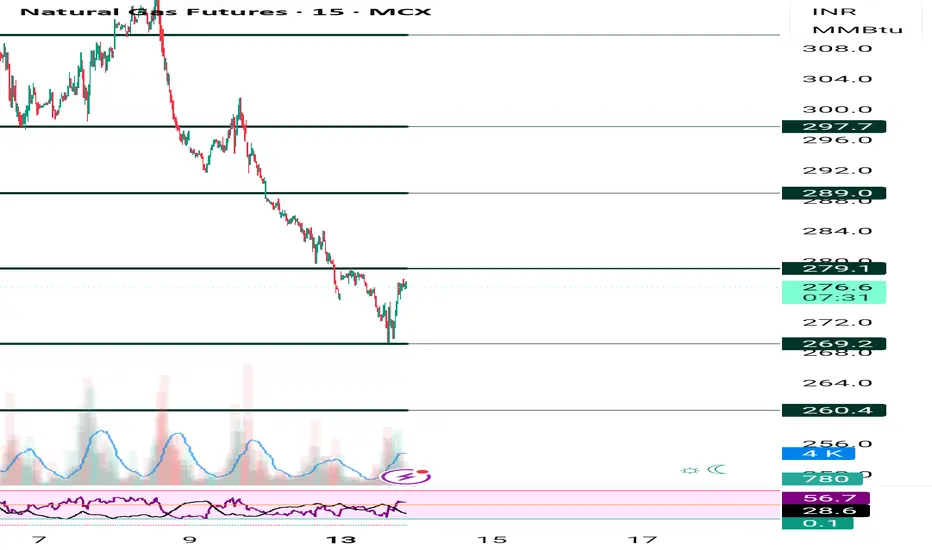
Natural gas as said yesterday more fall pending today done 275Natural gas yesterday said more fall pending today same is done , levels given on chart
How My Harmonic pattern projection Indicator work is explained below :
Recent High or Low :
D-0% is our recent low or high
Profit booking zone ( Early / Risky entry) : D 13.2% -D 16.1 % is
range if break them profit booking start on uptrend or downtrend but only profit booking, trend not changed
SL reversal zone (Safe entry ) : SL 23.1% and SL 25.5% is reversal zone if break then trend reverse and we can take reverse trade
Target : T1, T2, T3, T4 and .
Are our Target zone
Any Upside or downside level will activate only if break 1st level then 2nd will be active if break 2nd then 3rd will be active.
Total we have 7 important level which are support and resistance area
Until , 16% not break uptrend will continue if break then profit booking will start.
If break 25% then fresh downtrend will start then T1, T2,T3 will activate
1,3,5,10,15,20 minutes are short term levels.
30 minutes 60 minutes , 2 hours,3 hours, ... 1 day and 1 week chart positional and long term levels
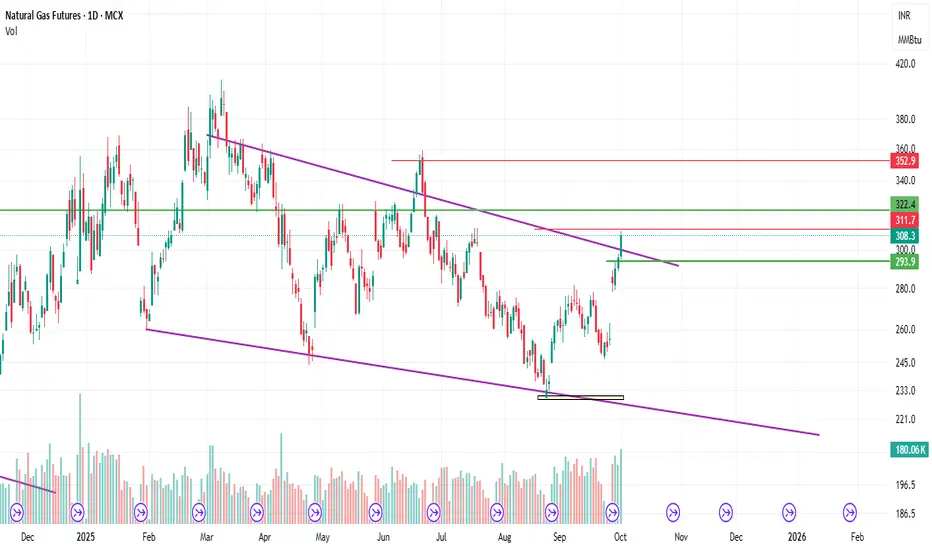
Natural Gas Levels For October 2025Important support and Resistance Levels For Natural Gas.
When Market touches the level, the price action plays important roles.
For More Learning Reach out to us.

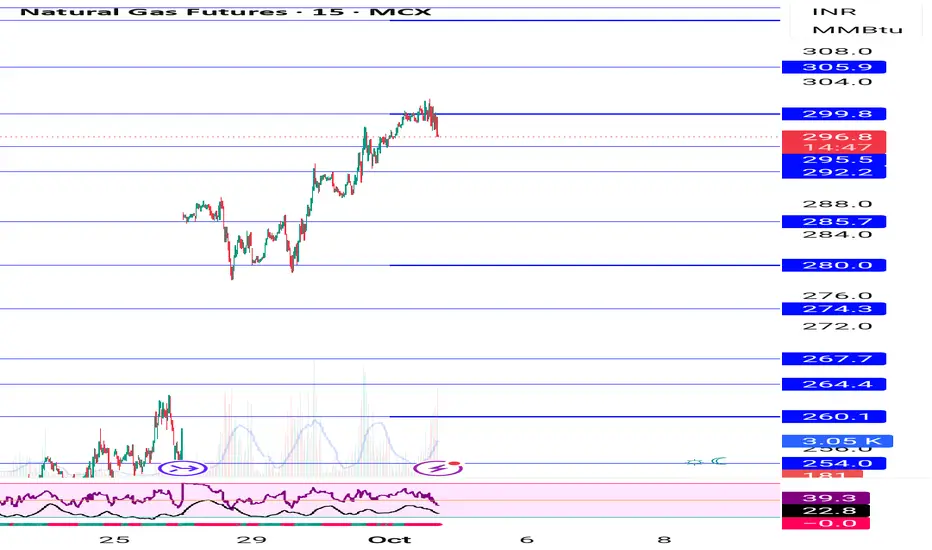
Natural gas yesterday booked at 312 now Wait for inventory dataNatural gas wait for inventory data then take fresh buy avoid sell
How My Harmonic pattern projection Indicator work is explained below :
Recent High or Low :
D-0% is our recent low or high
Profit booking zone ( Early / Risky entry) : D 13.2% -D 16.1 % is
range if break them profit booking start on uptrend or downtrend but only profit booking, trend not changed
SL reversal zone (Safe entry ) : SL 23.1% and SL 25.5% is reversal zone if break then trend reverse and we can take reverse trade
Target : T1, T2, T3, T4 and .
Are our Target zone
Any Upside or downside level will activate only if break 1st level then 2nd will be active if break 2nd then 3rd will be active.
Total we have 7 important level which are support and resistance area
Until , 16% not break uptrend will continue if break then profit booking will start.
If break 25% then fresh downtrend will start then T1, T2,T3 will activate
1,3,5,10,15,20 minutes are short term levels.
30 minutes 60 minutes , 2 hours,3 hours, ... 1 day and 1 week chart positional and long term levels
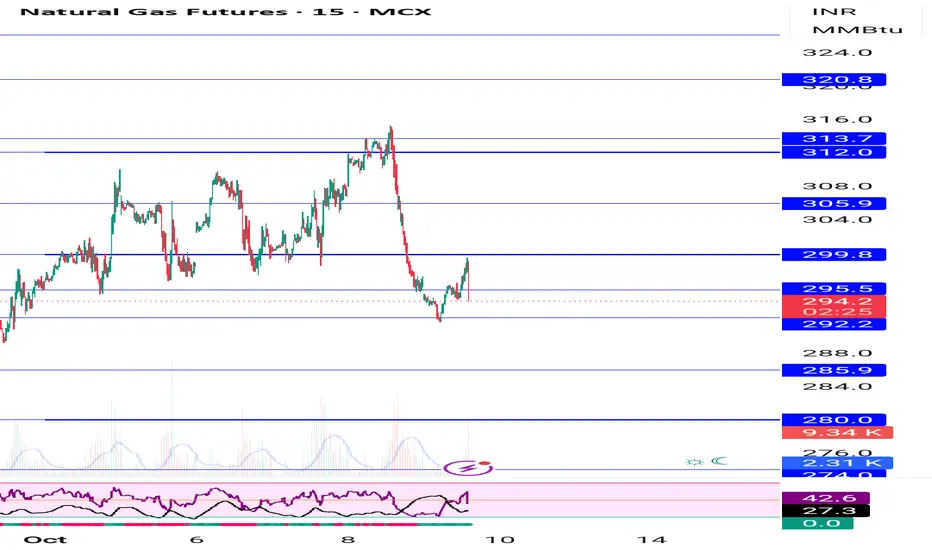
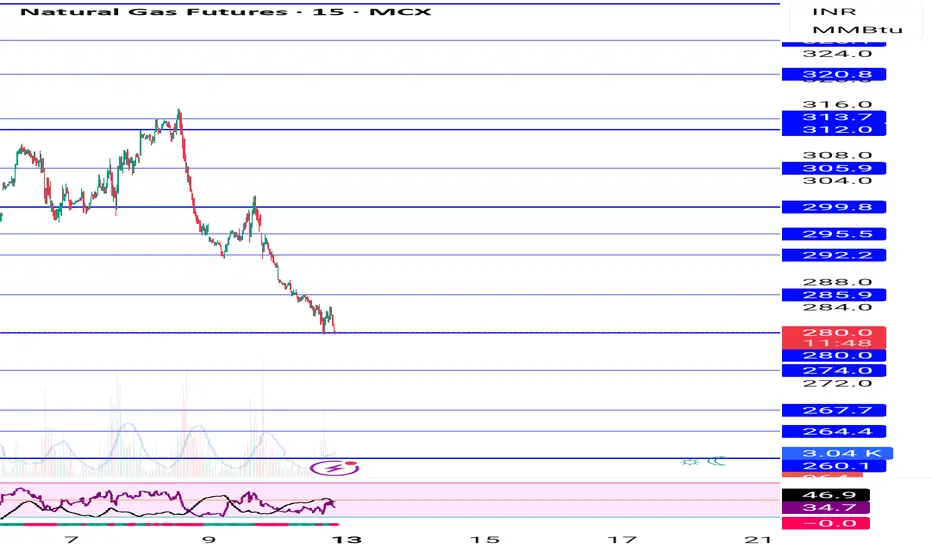
Natural gas as said yesterday more fall pending, bounce come Natural gas as said yesterday more fall possible 269 near come the. Bounce from support, start buying on dip near 270 -268
How My Harmonic pattern projection Indicator work is explained below :
Recent High or Low :
D-0% is our recent low or high
Profit booking zone ( Early / Risky entry) : D 13.2% -D 16.1 % is
range if break them profit booking start on uptrend or downtrend but only profit booking, trend not changed
SL reversal zone (Safe entry ) : SL 23.1% and SL 25.5% is reversal zone if break then trend reverse and we can take reverse trade
Target : T1, T2, T3, T4 and .
Are our Target zone
Any Upside or downside level will activate only if break 1st level then 2nd will be active if break 2nd then 3rd will be active.
Total we have 7 important level which are support and resistance area
Until , 16% not break uptrend will continue if break then profit booking will start.
If break 25% then fresh downtrend will start then T1, T2,T3 will activate
1,3,5,10,15,20 minutes are short term levels.
30 minutes 60 minutes , 2 hours,3 hours, ... 1 day and 1 week chart positional and long term levels
Natural gas continuesly buying recommended from 245 -242 levelsNatural gas continuesly buying recommended from 245-242 levels upside level given on chart until 295 not break upmove will continue
How My Harmonic pattern projection Indicator work is explained below :
Recent High or Low :
D-0% is our recent low or high
Profit booking zone ( Early / Risky entry) : D 13.2% -D 16.1 % is
range if break them profit booking start on uptrend or downtrend but only profit booking, trend not changed
SL reversal zone (Safe entry ) : SL 23.1% and SL 25.5% is reversal zone if break then trend reverse and we can take reverse trade
Target : T1, T2, T3, T4 and .
Are our Target zone
Any Upside or downside level will activate only if break 1st level then 2nd will be active if break 2nd then 3rd will be active.
Total we have 7 important level which are support and resistance area
Until , 16% not break uptrend will continue if break then profit booking will start.
If break 25% then fresh downtrend will start then T1, T2,T3 will activate
1,3,5,10,15,20 minutes are short term levels.
30 minutes 60 minutes , 2 hours,3 hours, ... 1 day and 1 week chart positional and long term levels

Divergence Secrets Option Premium Components
The option premium (price) has two parts:
Intrinsic Value: The actual value if exercised now (difference between stock price and strike price).
Time Value: The extra amount traders pay for the potential of future movement before expiry.
As expiry approaches, time value decreases, a phenomenon known as time decay (Theta).

ESG Investing and Carbon Credit Trading1. Understanding ESG Investing
1.1 Definition of ESG Investing
ESG investing refers to investment strategies that incorporate environmental, social, and governance factors into the analysis of companies and assets. Rather than solely focusing on financial returns, ESG investing evaluates:
Environmental (E): A company’s impact on the natural environment, including carbon emissions, waste management, water usage, and energy efficiency.
Social (S): The company’s relationships with employees, suppliers, customers, and communities. It includes labor standards, diversity and inclusion, community engagement, and human rights.
Governance (G): Corporate governance practices such as board structure, executive compensation, shareholder rights, transparency, and ethical business conduct.
ESG investing can take several forms, such as negative screening (excluding companies that harm society or the environment), positive screening (investing in companies with strong ESG practices), or impact investing (targeting investments that generate measurable social or environmental benefits alongside financial returns).
1.2 Evolution and Global Adoption
ESG investing gained traction in the early 2000s, influenced by growing awareness of climate change, social inequality, and corporate scandals. Key drivers include:
Regulatory pressures: Governments and regulatory bodies worldwide now require companies to disclose ESG risks and sustainability reporting.
Investor demand: Institutional investors, such as pension funds and sovereign wealth funds, increasingly prioritize ESG to mitigate long-term risks.
Corporate accountability: Companies with strong ESG profiles often demonstrate resilience, lower regulatory risks, and better operational efficiency.
The market for ESG investments has expanded exponentially. According to the Global Sustainable Investment Alliance (GSIA), sustainable investment assets exceeded $35 trillion globally in 2023, representing over 36% of total professionally managed assets.
1.3 ESG Investment Strategies
Negative Screening: Avoiding investments in sectors such as tobacco, fossil fuels, weapons, or companies with poor labor practices.
Positive Screening: Selecting companies with best-in-class ESG performance, e.g., renewable energy companies or firms with exemplary governance practices.
Thematic Investing: Focusing on specific sustainability themes like clean energy, water management, or gender equality.
Impact Investing: Targeting investments that generate measurable social or environmental impact in addition to financial returns.
ESG Integration: Incorporating ESG factors into traditional financial analysis to enhance risk-adjusted returns.
1.4 Benefits of ESG Investing
Risk Mitigation: ESG-focused companies are less prone to environmental liabilities, regulatory penalties, and reputational damage.
Long-term Value Creation: Sustainable practices often translate into operational efficiency, customer loyalty, and innovation.
Enhanced Portfolio Diversification: ESG investments may have lower correlations with traditional financial markets.
Alignment with Values: Investors can support ethical and sustainable business practices.
1.5 Challenges in ESG Investing
Data Inconsistency: ESG reporting standards vary across regions and companies, making comparisons difficult.
Greenwashing: Companies may exaggerate their ESG efforts to attract investment without meaningful impact.
Financial Trade-offs: Some ESG investments may underperform in the short term due to higher costs or niche markets.
Measurement Complexity: Quantifying social and governance impact is often subjective.
2. Carbon Credit Trading: An Overview
2.1 Definition and Concept
Carbon credit trading is a market-based mechanism aimed at reducing global carbon emissions. It operates under the principle of cap-and-trade, where a regulatory authority sets a limit (cap) on the total greenhouse gas emissions allowed for companies or sectors. Entities are issued carbon credits representing the right to emit one metric ton of CO2 or equivalent greenhouse gases.
If a company emits less than its allocated credits, it can sell the surplus in the carbon market. Conversely, companies that exceed their limits must purchase additional credits or face penalties. This creates a financial incentive to reduce emissions efficiently.
2.2 Historical Context
Carbon trading emerged from global climate agreements:
Kyoto Protocol (1997): Introduced the Clean Development Mechanism (CDM), allowing emission reductions to be traded internationally.
European Union Emission Trading Scheme (EU ETS, 2005): The first major regional carbon market, setting a benchmark for emissions trading globally.
Paris Agreement (2015): Reinforced carbon markets under Article 6, encouraging countries to collaborate in emission reductions.
2.3 Types of Carbon Credits
Compliance Credits: Issued under government-regulated cap-and-trade programs.
Voluntary Carbon Credits: Bought by companies or individuals to offset emissions voluntarily, often through projects like reforestation, renewable energy, or methane capture.
2.4 Mechanism of Carbon Trading
Cap Setting: Authorities determine the total allowable emissions for sectors or companies.
Credit Allocation: Companies receive carbon credits based on past emissions or regulatory quotas.
Trading: Companies can buy or sell credits depending on their actual emissions relative to their cap.
Verification: Third-party audits ensure reported emissions reductions are accurate and credible.
2.5 Market Participants
Corporations: Major emitters such as power plants, airlines, and industrial manufacturers.
Brokers and Traders: Facilitate buying and selling of carbon credits.
Governments and Regulatory Bodies: Establish rules, issue credits, and monitor compliance.
Environmental Projects: Generate carbon credits by implementing emission-reducing projects.
3. Integration of ESG Investing and Carbon Credit Trading
3.1 ESG and Carbon Markets Synergy
ESG investing and carbon credit trading are inherently linked, particularly through the environmental component. Companies with robust ESG strategies often engage in carbon credit trading to:
Offset unavoidable emissions.
Demonstrate commitment to climate targets.
Improve sustainability credentials for investors.
Investors increasingly assess carbon strategies as part of ESG due diligence. Companies actively participating in carbon markets may be more attractive for ESG-focused portfolios, aligning financial performance with sustainability outcomes.
3.2 Financial Implications
Hedging Climate Risk: By investing in companies that trade carbon credits or adopt low-carbon practices, investors reduce exposure to regulatory or reputational risks.
Revenue Generation: Selling surplus carbon credits provides an additional income stream.
Valuation Impact: Firms with effective carbon management often enjoy higher valuations and lower cost of capital.
3.3 Case Examples
Microsoft: Pledged to become carbon negative by 2030, investing in carbon credits and renewable projects.
Tesla: Generates revenue by selling regulatory carbon credits to other automakers.
BP and Shell: Invest in carbon offset projects to complement ESG commitments and mitigate emissions.
4. Global Trends in ESG and Carbon Markets
4.1 Rising Investor Awareness
ESG investment products, including mutual funds, ETFs, and green bonds, are growing rapidly.
Millennials and Gen Z investors prioritize sustainability, influencing capital flows.
4.2 Regulatory Push
The EU, UK, and US are tightening ESG disclosure requirements.
Mandatory reporting on Scope 1, 2, and 3 emissions enhances transparency and accountability.
4.3 Technological Innovations
Blockchain and digital registries improve the traceability of carbon credits.
Artificial intelligence helps analyze ESG data and monitor compliance.
4.4 Market Growth
The global voluntary carbon market is expected to exceed $50 billion by 2030.
ESG assets under management are projected to surpass $50 trillion by 2025, highlighting a long-term trend toward sustainability-focused finance.
5. Challenges and Criticisms
5.1 ESG Investing Challenges
Subjectivity: ESG ratings vary across agencies, leading to inconsistent assessments.
Greenwashing Risk: Companies may overstate sustainability achievements to attract capital.
Limited Impact: Some ESG investments may not translate into measurable environmental or social improvements.
5.2 Carbon Credit Trading Challenges
Verification Complexity: Ensuring credits correspond to real emission reductions is challenging.
Market Volatility: Carbon prices fluctuate due to regulatory changes or market sentiment.
Ethical Concerns: Over-reliance on offsets can allow continued emissions instead of driving systemic change.
6. Future Outlook
6.1 ESG Investing
ESG integration will become standard practice for asset managers and institutional investors.
Enhanced global ESG reporting standards, such as the International Sustainability Standards Board (ISSB), will improve transparency.
6.2 Carbon Credit Trading
Expansion of voluntary and compliance markets is expected, particularly in Asia-Pacific.
Innovations like nature-based carbon credits and digital carbon registries will enhance credibility and efficiency.
Carbon pricing may become more widespread, influencing corporate strategy and investment decisions.
6.3 Combined Impact
The synergy between ESG investing and carbon credit trading can accelerate the transition to a low-carbon economy. Financial markets will increasingly reward companies that embed sustainability into strategy and operations, making environmental stewardship a core value driver.
Conclusion
ESG investing and carbon credit trading represent transformative trends in global finance, emphasizing the integration of sustainability into investment decisions. ESG investing aligns financial returns with environmental and social responsibility, while carbon credit trading provides a market-driven mechanism for reducing greenhouse gas emissions. Both are critical tools in addressing climate change, promoting corporate accountability, and meeting the growing demand for sustainable investments.
Despite challenges such as data inconsistency, greenwashing, and verification complexities, the long-term outlook remains positive. As regulatory frameworks strengthen, technology improves, and investor awareness rises, ESG investing and carbon credit markets are poised to redefine the role of finance in building a sustainable, resilient global economy.
The interconnection of ESG and carbon trading illustrates a broader shift: capital is no longer just a means of generating profit; it is a lever for societal and environmental impact. Investors, corporations, and policymakers who embrace this integrated approach will shape the future of finance and the health of the planet.

natural gas natural gas moving toward forward not ideal place to buy buy option near 295-298 . trg upto 352
sl 272 .
NaturalGas looks bullishNaguralGas completed its second wave correction and expecting that it will show 3.680 (nearly).

Natural gas 302 target hit then some dip , again buy on dip 290Natural gas 302 target hit buy recommended near 280 , again buy near 290
How My Harmonic pattern projection Indicator work is explained below :
Recent High or Low :
D-0% is our recent low or high
Profit booking zone ( Early / Risky entry) : D 12.3% -D 16.1 % is
range if break them profit booking start on uptrend or downtrend but only profit booking, trend not changed
SL reversal zone (Safe entry ) : SL 23.1% and SL 25.5% is reversal zone if break then trend reverse and we can take reverse trade
Target : T1, T2, T3, T4 and .
Are our Target zone
Any Upside or downside level will activate only if break 1st level then 2nd will be active if break 2nd then 3rd will be active.
Total we have 7 important level which are support and resistance area
Until , 16% not break uptrend will continue if break then profit booking will start.
If break 25% then fresh downtrend will start then T1, T2,T3 will activate
1,3,5,10,15,20 minutes are short term levels.
30 minutes 60 minutes , 2 hours,3 hours, ... 1 day and 1 week chart positional and long term levels
Natural gas 268-260 dip possible then buy upside 295-302 target Natural gas updated levels given on chart initially 268-260 fall possible then buy upside 295-302 upside short term target for next 2 -3 weeks
How My Harmonic pattern projection Indicator work is explained below :
Recent High or Low :
D-0% is our recent low or high
Profit booking zone ( Early / Risky entry) : D 12.3% -D 16.1 % is
range if break them profit booking start on uptrend or downtrend but only profit booking, trend not changed
SL reversal zone (Safe entry ) : SL 23.1% and SL 25.5% is reversal zone if break then trend reverse and we can take reverse trade
Target : T1, T2, T3, T4 and .
Are our Target zone
Any Upside or downside level will activate only if break 1st level then 2nd will be active if break 2nd then 3rd will be active.
Total we have 7 important level which are support and resistance area
Until , 16% not break uptrend will continue if break then profit booking will start.
If break 25% then fresh downtrend will start then T1, T2,T3 will activate
1,3,5,10,15,20 minutes are short term levels.
30 minutes 60 minutes , 2 hours,3 hours, ... 1 day and 1 week chart positional and long term levels
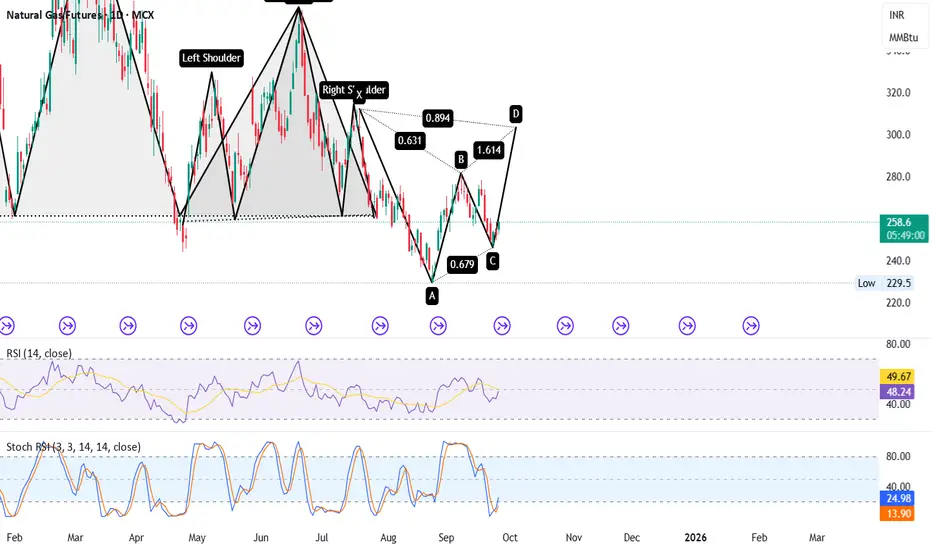
Natural Gas – Potential Bullish Reversal-304🔍 Key Highlights:
✅ XABCD Pattern Completion Zone:
XA to AB = 0.631 retracement
BC = 0.679 retracement
CD = 1.614 extension (projected move towards Point D)
✅ Bullish Structure in Progress:
Hidden Inverse Head & Shoulder supports bullish reversal
Confluence near Point C, increasing probability of trend reversal
✅ Momentum Confirmation:
RSI bouncing from neutral zone (47–49)
Stoch RSI reversing from oversold zone (13–23) – signaling early long buildup
🎯 Key Levels to Watch:
📈 Upside Target Zone (D): 1.614 extension zone
🛑 Invalidation: Break below recent Point C Low (229.5)
💡 Trading Insight:
This setup aligns with harmonic precision. If price holds the recent low and reverses with volume, Natural Gas may witness a strong upside bounce into the D leg completion.
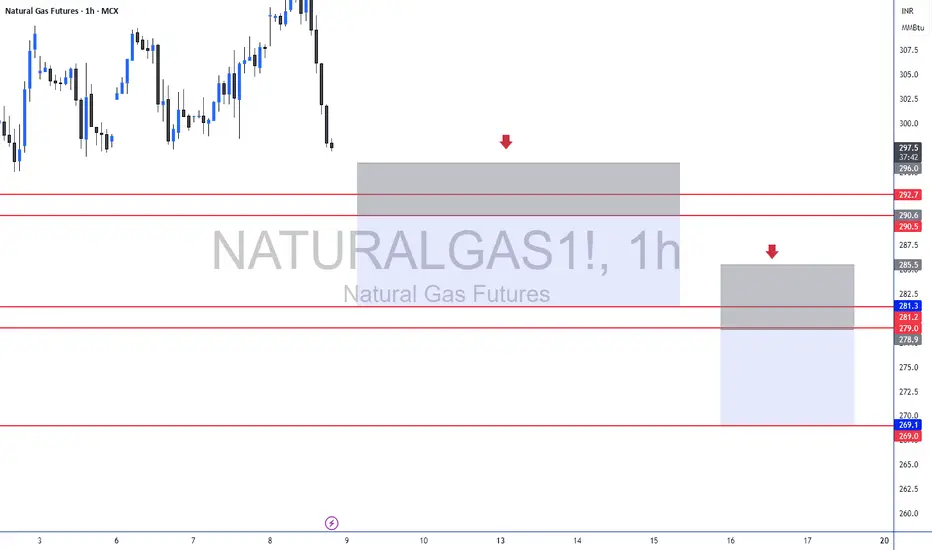
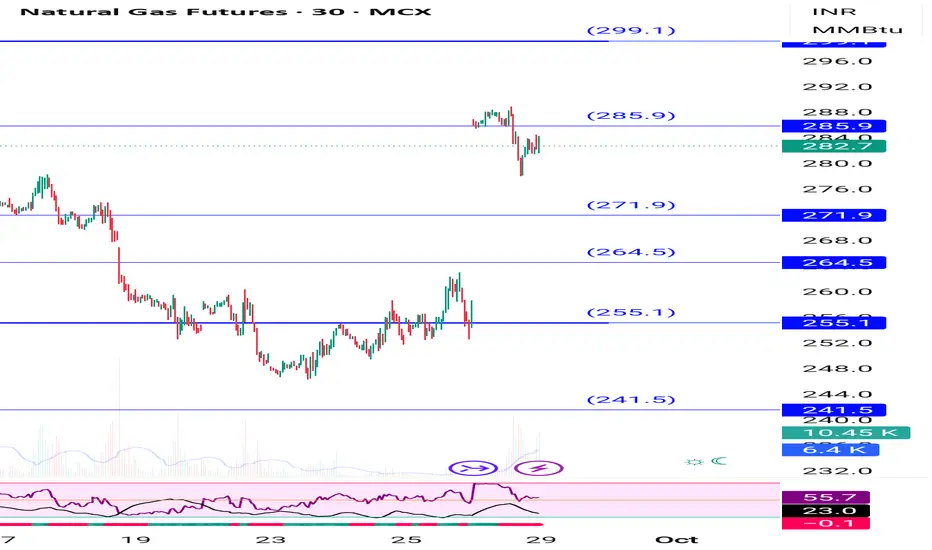
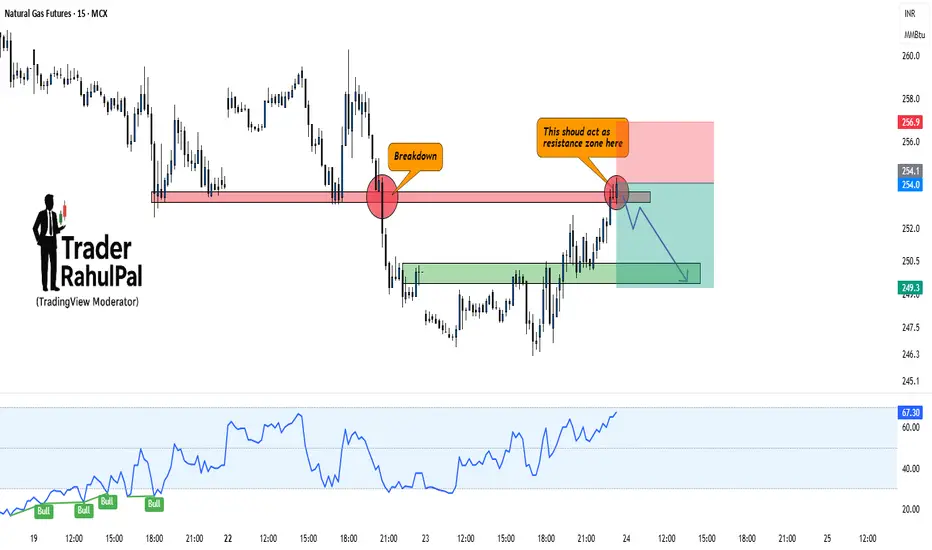
Natural Gas – Breakdown Retest Could Trigger Fresh FallHello everyone, Let's analyse Natural Gas and it has recently broken down from a key support level, turning it into resistance. The price is now retesting that zone, and unless bulls manage to reclaim it strongly, the downside remains the higher probability.
Current Setup:
Previous support around 254–256 has turned into a resistance zone.
Breakdown already confirmed with strong bearish candles.
RSI is still holding higher, but momentum may fade if resistance rejects.
Fresh downside targets can open toward 249–247 zone if rejection plays out.
Only a strong close above 257 will negate this bearish view.
Disclaimer: This analysis is for educational purposes only and should not be taken as financial advice. Please do your own research or consult your financial advisor before investing.
Analysis By @TraderRahulPal (TradingView Moderator) | More analysis & educational content on my profile
👉 If you found this helpful, don’t forget to like and follow for regular updates.
Natural Gas My last analysis about natural Gas was failed now it is in no trade zone , update you soon as I will see a trade opportunity.
Natural Gas longWe can plan natural Gas long position for a short term with very small Stoploss and small target
But risk reward ratio is high
Disclaimer; for education purpose only

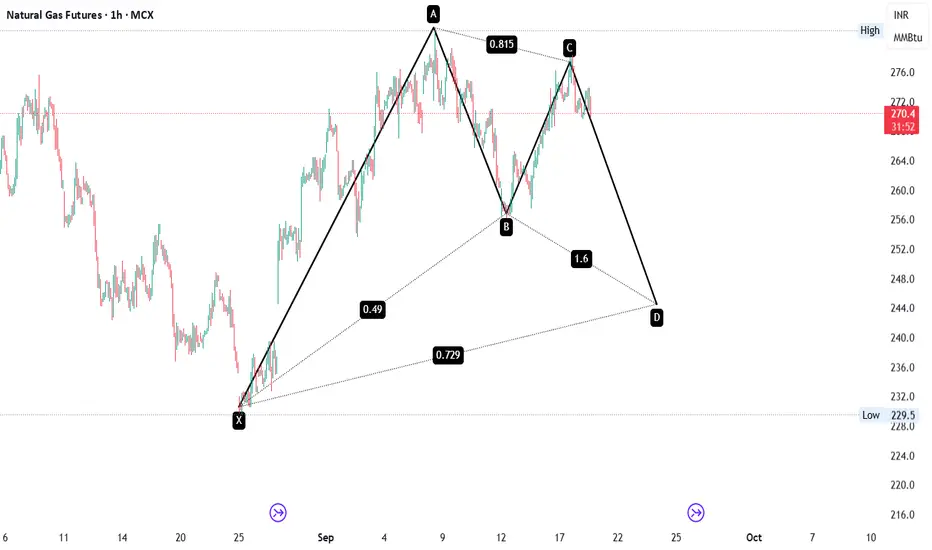
NATURAL GAS HARMONIC PATTERN
📈 Chart Pattern: Bearish Harmonic (Possibly Bearish Bat or Gartley Variant)
⚠️ Price Structure Breakdown:
A clean XABCD Harmonic Pattern is visible on the 1H timeframe:
🔹 XA Leg: Sharp impulsive rally from ₹229 → ₹281
🔹 AB Leg: Pullback retraced 49% of XA
🔹 BC Leg: Strong recovery to 81.5% of AB
🔹 CD Projection: 1.6x extension of BC, projecting a potential D point near ₹244–248 zone
📌 Key Technical Highlights:
✅ Pattern in play: Bearish harmonic indicating upcoming correction phase
🧲 D target zone aligns with previous demand cluster from late August
🔄 Ideal reversal zone between ₹244–248 (Watch for price-action confirmation near D)
🎯 Possible Trade Setup (Anticipated Post Completion at Point D):
📉 Sell NG Futures near ₹244–248 (on reversal confirmation)
🎯 Targets: ₹234 → ₹229
🛑 SL: Above ₹251 (on closing basis)
🧠 Why This Matters:
Harmonic patterns like this, especially with clean Fibonacci alignment, often mark high-probability reversal zones. Combined with volume + divergence filters, this zone could provide a lucrative swing trade setup.
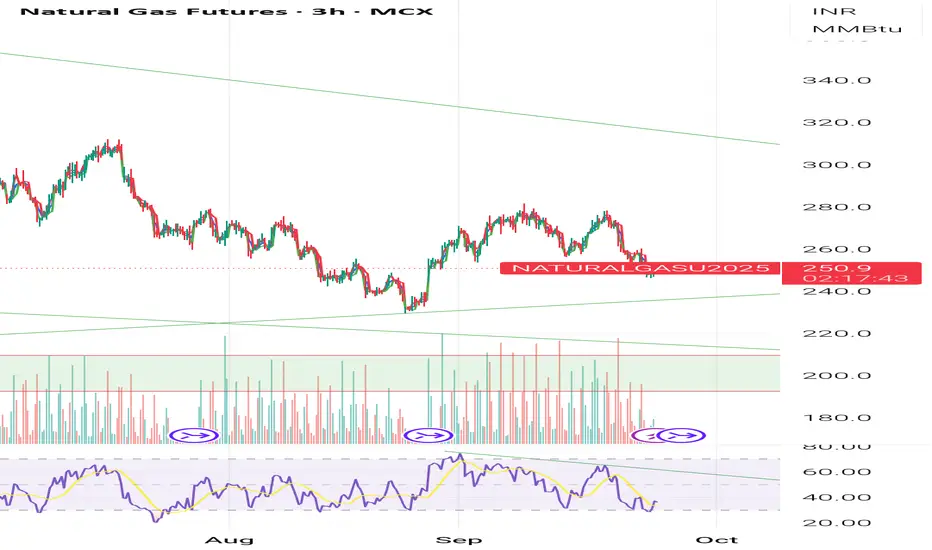
NATURALGAS1! 1D Time frame📍 Current Price
₹261
🔑 Key Levels
Immediate Resistance: ₹268 → ₹272
Immediate Support: ₹257 → ₹253
52-Week High: ₹366
52-Week Low: ₹188
Short-Term Outlook
Bullish Scenario: Sustained above ₹272 → possible move toward ₹280–₹285
Bearish Scenario: Falls below ₹257 → may test ₹253–₹250

NaturalGas BearishNaturalGas is taking resistance from Fibb 0.618 zone.
The RSI is also showing a hidden divergence with the price signalling further downside.
Close below 267.50 will take prices lower.
View neglected if prices moves above 285

Volume Profile & Market Structure AnalysisIntroduction
In modern financial markets, traders and investors rely on both price and volume to make informed decisions. While traditional technical analysis focuses heavily on price charts, patterns, and indicators, volume profile analysis introduces a powerful dimension: it shows not just where price has moved, but also where the most significant trading activity has occurred.
Markets are not simply a story of price fluctuations — they are a narrative of participation, commitment, and liquidity. By studying how much volume has traded at each price level, traders gain insights into which levels matter most to participants. This is where the volume profile becomes a key tool.
Coupled with market structure analysis — which identifies trends, ranges, supply-demand zones, and institutional footprints — traders can develop a deeper understanding of the underlying mechanics that drive market movement.
This guide explores the concepts of volume profile and market structure in detail, blending theory with practical application.
1. Understanding Volume in Trading
Volume represents the number of contracts, shares, or lots traded during a specific period.
High volume = Strong participation, more conviction.
Low volume = Weak participation, possible indecision.
Price movement alone can be deceptive. A rally with low volume may simply be speculative or driven by a few participants. Conversely, a rally with high volume suggests genuine market consensus and institutional interest.
Thus, when price is studied together with volume, we see where money is flowing in and out of the market.
2. What is Volume Profile?
Volume Profile is a charting tool that displays trading activity over a chosen time period at specified price levels. Unlike the typical volume indicator shown below price bars (which measures activity over time), volume profile shows how much volume was transacted at each price level.
It usually appears on the side of the chart as a histogram.
Key elements:
Point of Control (POC):
The price level with the highest traded volume. It’s often seen as the market’s “fair value.”
Value Area (VA):
The range where around 70% of trading activity occurred.
Value Area High (VAH): Top of the value range.
Value Area Low (VAL): Bottom of the value range.
High Volume Nodes (HVN):
Price zones where large amounts of trading took place — representing strong support/resistance.
Low Volume Nodes (LVN):
Price levels with little trading — often act as rejection zones where price moves quickly through.
In essence, volume profile reveals where participants are most interested in trading.
3. Why Volume Profile Matters
Identifies strong support/resistance: Prices with high volume tend to act as magnets.
Reveals institutional activity: Large players accumulate or distribute around high-volume zones.
Helps detect breakouts/fakeouts: If price moves away from a value area with volume, it’s often more sustainable.
Guides risk management: Stop-loss and target levels can be aligned with volume nodes.
For example, if the POC is at 15,000 in Nifty futures, traders know this is a strong pivot point. If price is above POC, bias is bullish; if below, bearish.
4. Building Blocks of Market Structure
While volume profile explains where participants are most active, market structure explains how the market moves.
Market structure refers to the repetitive patterns of price behavior, shaped by supply and demand imbalances.
a) Phases of Market Structure
Accumulation: Institutions build positions after a downtrend. Volume increases slowly.
Markup: Price trends upward, breaking resistance levels.
Distribution: Institutions unload holdings to late buyers at higher prices.
Markdown: Market declines as selling pressure outweighs demand.
b) Market Structure Basics
Higher Highs (HH) & Higher Lows (HL): Uptrend.
Lower Highs (LH) & Lower Lows (LL): Downtrend.
Equal Highs/Lows: Range or consolidation.
Traders map these swings to understand whether the market is bullish, bearish, or neutral.
5. Integrating Volume Profile with Market Structure
When combined, these two frameworks become powerful:
Trend confirmation: In an uptrend, high-volume nodes forming higher also confirm strong institutional support.
Range identification: A wide value area often signals consolidation.
Breakout validation: If price breaks above value area with high volume, chances of continuation are strong.
Liquidity hunts: Price may dip into low-volume nodes to trap traders before reversing.
Example: If Bank Nifty is making higher highs but each move is supported by rising POC levels, it confirms strength in the trend.
6. Practical Applications for Traders
a) Day Trading with Volume Profile
Identify intraday POC and VAH/VAL.
Trade rejections from value extremes (fade strategy).
Trade breakouts above VAH or below VAL with volume confirmation.
b) Swing Trading
Use weekly/monthly volume profiles.
Enter near HVNs (support zones) and exit near opposing HVNs.
Align swing trades with broader market structure (trend direction).
c) Position Trading
Focus on long-term volume profiles (quarterly/yearly).
Look for accumulation/distribution footprints of institutions.
Hold positions around POC shifts (where market’s fair value is migrating).
7. Volume Profile Strategies
Strategy 1: Value Area Rejection
If price moves above VAH but volume doesn’t confirm, expect a return back inside the value area.
Works best in range-bound markets.
Strategy 2: Value Area Breakout
If price breaks VAH/VAL with strong volume, trade in the breakout direction.
Works best in trending markets.
Strategy 3: POC Reversal
When price revisits the POC after a strong move, watch for reversal or continuation signals.
Strategy 4: Low-Volume Node Play
Price tends to move quickly across LVNs since there’s little resistance there.
8. Market Structure Strategies
Strategy 1: BOS (Break of Structure)
When price breaks a previous swing high in an uptrend → confirms continuation.
Strategy 2: CHoCH (Change of Character)
When price shifts from making HH/HL to LH/LL → signals reversal.
Strategy 3: Liquidity Grab
Market often sweeps previous highs/lows to trigger stop-losses before moving in the real direction.
Strategy 4: Supply/Demand Zones
Identify areas of sharp moves with high volume → strong institutional orders likely exist there.
9. Case Study Example (Nifty Futures)
Imagine Nifty is trading around 19,800.
Daily volume profile shows POC at 19,750.
VAH = 19,820, VAL = 19,700.
Scenario:
Price breaks above VAH with strong volume → continuation likely.
If it rejects above 19,820 and comes back inside → fade trade down to POC.
Market structure shows HH/HL → aligns with breakout trades.
Thus, both tools together offer context + execution clarity.
10. Psychological Edge of Volume Profile & Market Structure
Traders feel more confident when trades are backed by objective volume data rather than just subjective chart patterns.
Understanding market structure helps avoid emotional decisions by providing a map of price behavior.
Together, they reduce overtrading and improve patience by waiting for high-probability zones.
Conclusion
Volume Profile and Market Structure are two complementary tools that transform how traders view the market.
Volume Profile shows the hidden story of participation, liquidity, and fair value.
Market Structure provides the roadmap of how price evolves over time.
Together, they:
Identify high-probability trading zones.
Reveal institutional footprints.
Help traders avoid emotional decisions.
However, success lies not in the tools alone but in how consistently and patiently traders apply them with risk management. Over time, these methods can provide a decisive edge in understanding and navigating financial markets.