NATURALGASIT HAS GOOD SUPPORT NEAR BY AND GO LONG AND ADD ON DIPS TILL 130
It is purely educational purpose
Natural Gas Futures
Trade ideas

NaturalGas Crucial level Analysis Side base range: 131.6-159.5
currently It's trend is downtrend and 163 level is very crucial .if day closing below this range then it will be in side base range.

Natural gas 179 until not break sell on rise levels on chartDisclaimer -
This information is only for educational purposes, this is not for any buy or sell recommendations .
On Our Harmonic pattern indicator
based trade setup take trade as explained below :-
ENTRY -
When price breaks 30% retracement Which is D points then take Entry on Buy or Sell Trade
SL -
SL is (-3%) Which is mentioned in Chart . our SL is just above or below of Recent high or Low .
TARGET -
Target 1- (T1 : 61.8 %)
Target 2- (T2 : 88.6 %)
Target 3- (T3 : 127.2 %)
Target 4- (T4 : 161.8 %)
Please note:-
It's working on news based and volitile market very well so exit if SL hit

Ng buy given near 172 , 7 points profit running 185, 193 next Disclaimer -
This information is only for educational purposes, this is not for any buy or sell recommendations .
On Our Harmonic pattern indicator
based trade setup take trade as explained below :-
ENTRY -
When price breaks 30% retracement Which is D points then take Entry on Buy or Sell Trade
SL -
SL is (-3%) Which is mentioned in Chart . our SL is just above or below of Recent high or Low .
TARGET -
Target 1- (T1 : 61.8 %)
Target 2- (T2 : 88.6 %)
Target 3- (T3 : 127.2 %)
Target 4- (T4 : 161.8 %)
Please note:-
It's working on news based and volitile market very well so exit if SL hit

Ng again weak if break 168 then sell sl 172 Target 162, 153 ,146Disclaimer -
This information is only for educational purposes, this is not for any buy or sell recommendations .
On Our Harmonic pattern indicator
based trade setup take trade as explained below :-
ENTRY -
When price breaks 30% retracement Which is D points then take Entry on Buy or Sell Trade
SL -
SL is (-3%) Which is mentioned in Chart . our SL is just above or below of Recent high or Low .
TARGET -
Target 1- (T1 : 61.8 %)
Target 2- (T2 : 88.6 %)
Target 3- (T3 : 127.2 %)
Target 4- (T4 : 161.8 %)
Please note:-
It's working on news based and volitile market very well so exit if SL hit

Ng again sell given at 179 172 running book profit Disclaimer -
This information is only for educational purposes, this is not for any buy or sell recommendations .
On Our Harmonic pattern indicator
based trade setup take trade as explained below :-
ENTRY -
When price breaks 30% retracement Which is D points then take Entry on Buy or Sell Trade
SL -
SL is (-3%) Which is mentioned in Chart . our SL is just above or below of Recent high or Low .
TARGET -
Target 1- (T1 : 61.8 %)
Target 2- (T2 : 88.6 %)
Target 3- (T3 : 127.2 %)
Target 4- (T4 : 161.8 %)
Please note:-
It's working on news based and volitile market very well so exit if SL hit

Naturalgas | BULLISH | July 19Natural Gas: Bullish Cup and Handle Setup (1h) ☕️
Heads up, gas bulls! A cup and handle pattern is forming on the 1-hour chart for natural gas.
Current Price: Hovering around 175 - 177
Target: Eyes on a potential breakout
Target 1 - 179
Target 2 - 183
Support: Watch the175.5 level as key support.
Confirmation: A decisive break and close above the handle could signal further upside.
Disclaimer: This analysis is for informational purposes only. Do your own research before making any trading decisions.
#NaturalGas #Trading #TechnicalAnalysis

Natural gas buy trade active from 179 hold sl 182 , 195 Target Disclaimer -
This information is only for educational purposes, this is not for any buy or sell recommendations .
On Our Harmonic pattern indicator
based trade setup take trade as explained below :-
ENTRY -
When price breaks 30% retracement Which is D points then take Entry on Buy or Sell Trade
SL -
SL is (-3%) Which is mentioned in Chart . our SL is just above or below of Recent high or Low .
TARGET -
Target 1- (T1 : 61.8 %)
Target 2- (T2 : 88.6 %)
Target 3- (T3 : 127.2 %)
Target 4- (T4 : 161.8 %)
Please note:-
It's working on news based and volitile market very well so exit if SL hit

Natural gas buy above 179 sl 166 upside Target mentioned @ChartDisclaimer -
This information is only for educational purposes, this is not for any buy or sell recommendations .
On Our Harmonic pattern indicator
based trade setup take trade as explained below :-
ENTRY -
When price breaks 30% retracement Which is D points then take Entry on Buy or Sell Trade
SL -
SL is (-3%) Which is mentioned in Chart . our SL is just above or below of Recent high or Low .
TARGET -
Target 1- (T1 : 61.8 %)
Target 2- (T2 : 88.6 %)
Target 3- (T3 : 127.2 %)
Target 4- (T4 : 161.8 %)
Please note:-
It's working on news based and volitile market very well so exit if SL hit

Natural gas yesterday booked 70 points profit making baseDisclaimer -
This information is only for educational purposes, this is not for any buy or sell recommendations .
On Our Harmonic pattern indicator
based trade setup take trade as explained below :-
ENTRY -
When price breaks 30% retracement Which is D points then take Entry on Buy or Sell Trade
SL -
SL is (-3%) Which is mentioned in Chart . our SL is just above or below of Recent high or Low .
TARGET -
Target 1- (T1 : 61.8 %)
Target 2- (T2 : 88.6 %)
Target 3- (T3 : 127.2 %)
Target 4- (T4 : 161.8 %)
Please note:-
It's working on news based and volitile market very well so exit if SL hit

Natural gas avoid any fresh sell trade now we sold at 249 Disclaimer -
This information is only for educational purposes, this is not for any buy or sell recommendations .
On Our Harmonic pattern indicator
based trade setup take trade as explained below :-
ENTRY -
When price breaks 30% retracement Which is D points then take Entry on Buy or Sell Trade
SL -
SL is (-3%) Which is mentioned in Chart . our SL is just above or below of Recent high or Low .
TARGET -
Target 1- (T1 : 61.8 %)
Target 2- (T2 : 88.6 %)
Target 3- (T3 : 127.2 %)
Target 4- (T4 : 161.8 %)
Please note:-
It's working on news based and volitile market very well so exit if SL hit

Natural gas sold at 249 next Target 162, 154 trail SL to 181Disclaimer -
This information is only for educational purposes, this is not for any buy or sell recommendations .
On Our Harmonic pattern indicator
based trade setup take trade as explained below :-
ENTRY -
When price breaks 30% retracement Which is D points then take Entry on Buy or Sell Trade
SL -
SL is (-3%) Which is mentioned in Chart . our SL is just above or below of Recent high or Low .
TARGET -
Target 1- (T1 : 61.8 %)
Target 2- (T2 : 88.6 %)
Target 3- (T3 : 127.2 %)
Target 4- (T4 : 161.8 %)
Please note:-
It's working on news based and volitile market very well so exit if SL hit

Natural gas sell given at 249 , 175,173 next Target sl 195Disclaimer -
This information is only for educational purposes, this is not for any buy or sell recommendations .
On Our Harmonic pattern indicator
based trade setup take trade as explained below :-
ENTRY -
When price breaks 30% retracement Which is D points then take Entry on Buy or Sell Trade
SL -
SL is (-3%) Which is mentioned in Chart . our SL is just above or below of Recent high or Low .
TARGET -
Target 1- (T1 : 61.8 %)
Target 2- (T2 : 88.6 %)
Target 3- (T3 : 127.2 %)
Target 4- (T4 : 161.8 %)
Please note:-
It's working on news based and volitile market very well so exit if SL hit

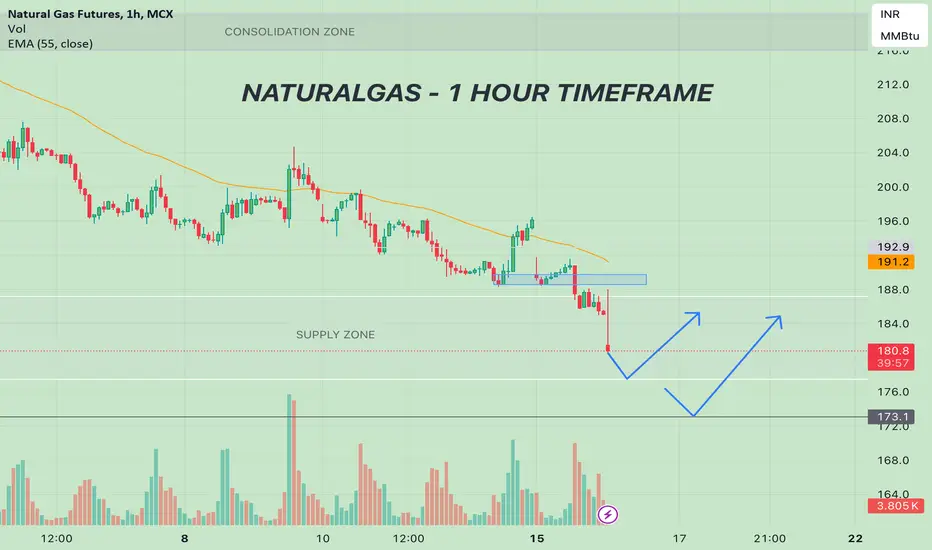
Natural Gas (NG) - 1 hour timeframe (July 16, 2024)
Current Situation: Natural Gas is currently trading in a supply zone, indicating potential selling pressure.
Support Levels:
Support 1: 177.50
Support 2: 173.10
Bearish Factors:
Cooler weather forecast: This could reduce demand for natural gas for heating purposes.
Freeport LNG disruptions: Continued issues at the Freeport LNG export facility are limiting demand for natural gas.
Overall: Downward pressure is expected on natural gas prices due to the bearish factors mentioned above. The support levels will be crucial in determining the price direction.
Disclaimer: This information is for educational purposes only and should not be considered financial advice.
Natural Gas MCX Future Intraday Technical Analysis 15 July, 2024📈 NG MCX Future Technical Chart Analysis
📊 Range Trigger Point: 196.00
📉 Day Range: 8.20
📅 Level Type: Daily
📅 Valid For: 15 to 19 July, 2024
📈 Buy Above: 193.37
💼 Average Position: 192.40
🎯 Buy Target 1: 201.07
🎯 Buy Target 2: 204.20
🛑 Stoploss: 190.64
📉 Sale Below: 191.43
🎯 Sale Target 1: 190.93
🎯 Sale Target 2: 187.80
🛑 Stoploss: 194.16
✨ Follow and engage for more insightful updates. Your engagement fuels our dedication to providing top-notch content! 🚀❤️
#NG #NaturalGas #MCX #Commodities #Trading #TechnicalAnalysis #StockMarket #Investment #TradingTips #MarketAnalysis

Natural Gas MCX Future Weekly Technical Analysis 15-19 July📈 NG MCX Future Technical Chart Analysis
📊 Range Trigger Point: 196.00
📉 Weekly Range: 16.40
📅 Level Type: Weekly
📅 Valid For: 15 to 19 July, 2024
📈 Buy Above: 198.44
💼 Average Position: 196.50
🎯 Buy Target 1: 206.14
🎯 Buy Target 2: 212.40
🛑 Stoploss: 192.97
📉 Sale Below: 194.56
🎯 Sale Target 1: 185.86
🎯 Sale Target 2: 179.60
🛑 Stoploss: 200.03
✨ Follow and engage for more insightful updates. Your engagement fuels our dedication to providing top-notch content! 🚀❤️
#NG #MCX #Commodities #Trading #TechnicalAnalysis #StockMarket

Natural gas avoid fresh sell we sold @249Disclaimer -
This information is only for educational purposes, this is not for any buy or sell recommendations .
On Our Harmonic pattern indicator
based trade setup take trade as explained below :-
ENTRY -
When price breaks 30% retracement Which is D points then take Entry on Buy or Sell Trade
SL -
SL is (-3%) Which is mentioned in Chart . our SL is just above or below of Recent high or Low .
TARGET -
Target 1- (T1 : 61.8 %)
Target 2- (T2 : 88.6 %)
Target 3- (T3 : 127.2 %)
Target 4- (T4 : 161.8 %)
Please note:-
It's working on news based and volitile market very well so exit if SL hit

Natural Gas (NG) - Potential Breakout Watch - July 11, 2024
Current Situation: Natural Gas is currently trading around 195.75 (based on your previous info).
Analysis: We're observing a potential breakout situation on the chart.
Bullish Breakout: If Natural Gas breaks and closes above 196.5, it could signal a potential price increase.
Target: No specific target mentioned, but a breakout typically suggests prices could move upwards.
Invalidation: A price drop below 194.5 would weaken the bullish case and suggest a potential downside move.

Natural Gas MCX Fut Technical Chart Analysis 11 July, 2024📈 NG MCX Future Technical Chart Analysis
📊 Range Trigger Point: 194.90
📉 Day Range: 7.60
📈 Buy Above: 196.80
💼 Average Position: 195.90
🎯 Buy Target 1: 199.60
🎯 Buy Target 2: 202.50
🛑 Stoploss: 194.27
📉 Sale Below: 195.00
🎯 Sale Target 1: 190.20
🎯 Sale Target 2: 187.30
🛑 Stoploss: 197.53
✨ Follow and engage for more insightful updates. Your engagement fuels our dedication to providing top-notch content! 🚀❤️
#NaturalGas #NG #MCX #Commodities #Trading #TechnicalAnalysis #EnergyTrading #StockMarket #Finance

Natural Gas Bullish Wedge Breakout Watch - 10 JULY VANTAGE:NG Eyes Bullish Breakout! (July 10, 2024)
1-hour Chart: Falling wedge pattern hints at a potential price reversal.
Current Price: ≈ 199.5
Bullish Signal: Watch for a break and close above 199.5 (resistance).
Downtrend resumes if price falls below 198.3.(Support)
Volume: Increased trading volume on the breakout would strengthen the bullish case.
Disclaimer:
This information is for educational purposes only and should not be considered financial advice.


Go SHORT on NaturalGas FuturesEnter at CMP - 195.6-195.0 (Jul'24 contract), with SL - 209.6 and Target1-182, Target2-156.6 & Target3-150.6. Post achieving Target3, risk takers can book half and target Final - 135, by moving SL to 159.6. If my prediction is right, it should take Target3 by 18th Jul'24 or can go till 24th Jul. July contract expiry is 26th Jul.

NATURAL GAS-Likely pull out rallyNATURAL GAS:Has sucessfully breached its horizontal trend line resistence.likely EMA Cross over suggests a move towards 202-205 with 197 SL(For educational purpose only)
