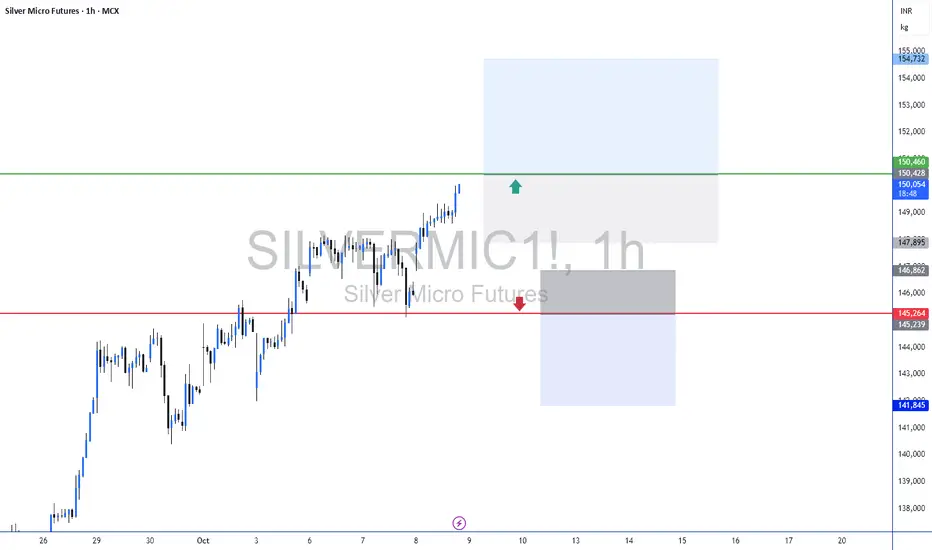
Silver holding buy trade from 148350, target 153400, 155700Silver holding buy trade from 148350 target 153400, 155700 levels given on chart
How My Harmonic pattern projection Indicator work is explained below :
Recent High or Low :
D-0% is our recent low or high
Profit booking zone ( Early / Risky entry) : D 13.2% -D 16.1 % is
range if break them profit booking start on uptrend or downtrend but only profit booking, trend not changed
SL reversal zone (Safe entry ) : SL 23.1% and SL 25.5% is reversal zone if break then trend reverse and we can take reverse trade
Target : T1, T2, T3, T4 and .
Are our Target zone
Any Upside or downside level will activate only if break 1st level then 2nd will be active if break 2nd then 3rd will be active.
Total we have 7 important level which are support and resistance area
Until , 16% not break uptrend will continue if break then profit booking will start.
If break 25% then fresh downtrend will start then T1, T2,T3 will activate
1,3,5,10,15,20 minutes are short term levels.
30 minutes 60 minutes , 2 hours,3 hours, ... 1 day and 1 week chart positional and long term levels
Silver Micro Futures
Trade ideas

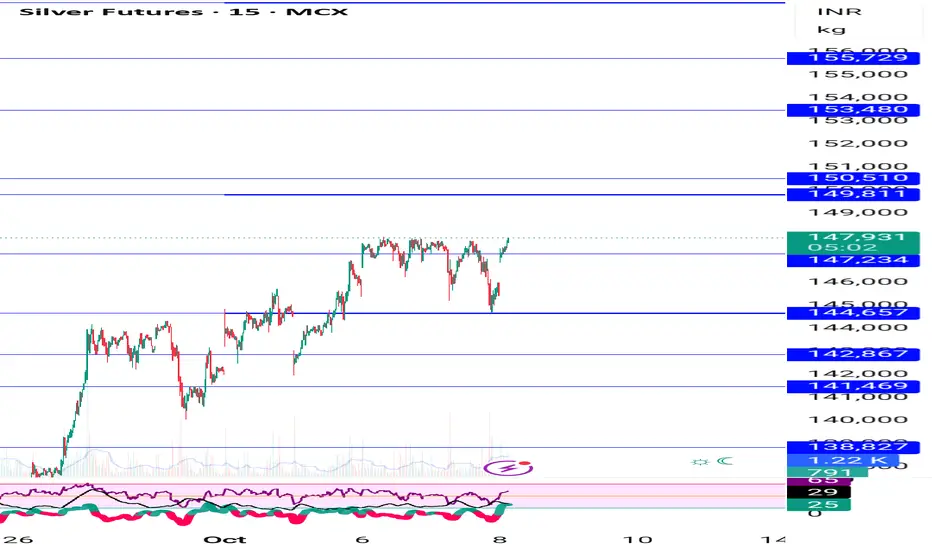
Silver Levels For October 2025Important support and Resistance Levels For Silver.
When Market touches the level, the price action plays important roles.
For More Learning Reach out to us.
Silver 5000-5500 points upmove from previous buy given hold buySilver upmove will continue next target 49.80 to 49.90 on comex , mcx levels given on chart but fallow comex levels
How My Harmonic pattern projection Indicator work is explained below :
Recent High or Low :
D-0% is our recent low or high
Profit booking zone ( Early / Risky entry) : D 13.2% -D 16.1 % is
range if break them profit booking start on uptrend or downtrend but only profit booking, trend not changed
SL reversal zone (Safe entry ) : SL 23.1% and SL 25.5% is reversal zone if break then trend reverse and we can take reverse trade
Target : T1, T2, T3, T4 and .
Are our Target zone
Any Upside or downside level will activate only if break 1st level then 2nd will be active if break 2nd then 3rd will be active.
Total we have 7 important level which are support and resistance area
Until , 16% not break uptrend will continue if break then profit booking will start.
If break 25% then fresh downtrend will start then T1, T2,T3 will activate
1,3,5,10,15,20 minutes are short term levels.
30 minutes 60 minutes , 2 hours,3 hours, ... 1 day and 1 week chart positional and long term levels
silver short term update silver looks on pressure now silver stya blw 47.60 in mcx 145850 stya blw sharp dwnfall expect 145300-145 thna after 143 near sell on rise after with 147819 sl
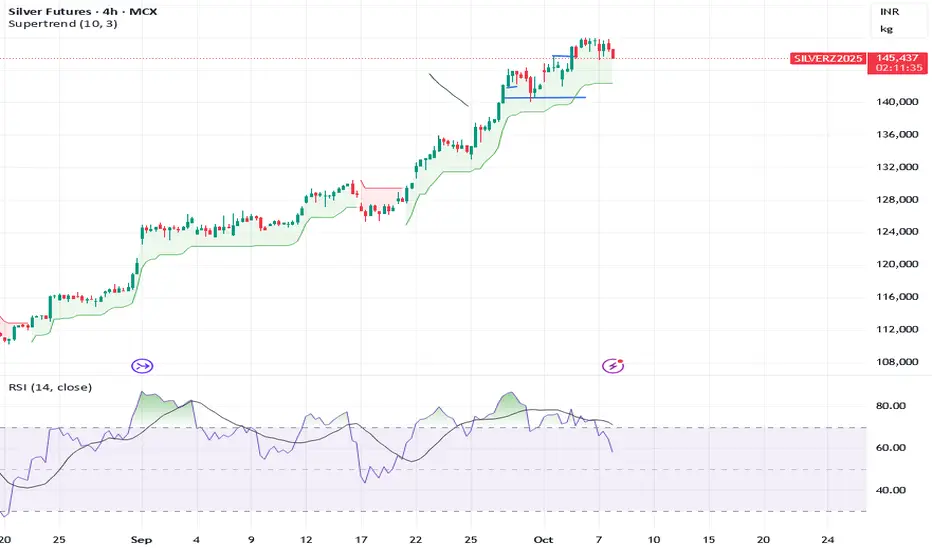
Silver Brewing a fall soon?
Sell Silver Futures
Rationale:
Silver has formed a rising wedge pattern on the 4-hour chart, indicating exhaustion in the recent uptrend. Price action shows multiple rejections near $48.40–$48.50, while the CCI momentum indicator is flattening after reaching overbought territory, hinting at a potential reversal. A breakdown below $48.00 could trigger a corrective wave toward $45.70.
Macro Headwinds:
• US Dollar Strength: The Dollar Index continues to hold firm above 105 amid hawkish Fed commentary, limiting upside for precious metals.
• Rising US Yields: The US 10-year yield remains elevated, making non-yielding assets like Silver less attractive in the short term.
• Cooling Industrial Demand: Recent Chinese PMI data points to a softening recovery in the manufacturing sector, a key demand driver for Silver.
• Fed Rate Outlook: Markets are now pricing in the possibility of delayed rate cuts, keeping real rates higher for longer that is a negative for Silver.
Key Levels:
• Entry Zone: Below $48.05
• Stop Loss: $49.47
• Target: $45.70
• Risk–Reward Ratio: ~1:2.5
Technical View:
Trendline breakdown confirmation on the 4-hour timeframe would validate the short setup. Sustained trade below $48.00 may invite further selling pressure, with supports seen near $47.00 and $45.70. A decisive close above $49.50 would invalidate the bearish structure.

Silver Futures ViewSilver seems to have hit near the psychological level of 1,50,000. Some downturn might be expected till 1,42,000, if it doesn't break the hurdle.
Silver holding buynfrom 144000 , target 145600Silver holding buy from 144000, target 145600 , upside target big but mcx closed tomorrow so will book profit.
Yesterday also bought at 141500 and booked today at 144100
How My Harmonic pattern projection Indicator work is explained below :
Recent High or Low :
D-0% is our recent low or high
Profit booking zone ( Early / Risky entry) : D 12.3% -D 16.1 % is
range if break them profit booking start on uptrend or downtrend but only profit booking, trend not changed
SL reversal zone (Safe entry ) : SL 23.1% and SL 25.5% is reversal zone if break then trend reverse and we can take reverse trade
Target : T1, T2, T3, T4 and .
Are our Target zone
Any Upside or downside level will activate only if break 1st level then 2nd will be active if break 2nd then 3rd will be active.
Total we have 7 important level which are support and resistance area
Until , 16% not break uptrend will continue if break then profit booking will start.
If break 25% then fresh downtrend will start then T1, T2,T3 will activate
1,3,5,10,15,20 minutes are short term levels.
30 minutes 60 minutes , 2 hours,3 hours, ... 1 day and 1 week chart positional and long term levels

Double Top in SilverEntry- 143000-143200
Target- 142000, 141500, 141200
SL- Day high
Pattern - Double Top has been made in MCX silver and Comex silver in 1 hr and 15 min time frame.
Disclaimer- This is just for educational purpose.
Jai Shree Ram.

Silver mcx updated levels buy near support 50$ 1st on comex comeSilver mcx updated levels given on chart,silver mcx 10-12 % upside still possible, silver will try to break previous ATH and make fresh ATH
How My Harmonic pattern projection Indicator work is explained below :
Recent High or Low :
D-0% is our recent low or high
Profit booking zone ( Early / Risky entry) : D 12.3% -D 16.1 % is
range if break them profit booking start on uptrend or downtrend but only profit booking, trend not changed
SL reversal zone (Safe entry ) : SL 23.1% and SL 25.5% is reversal zone if break then trend reverse and we can take reverse trade
Target : T1, T2, T3, T4 and .
Are our Target zone
Any Upside or downside level will activate only if break 1st level then 2nd will be active if break 2nd then 3rd will be active.
Total we have 7 important level which are support and resistance area
Until , 16% not break uptrend will continue if break then profit booking will start.
If break 25% then fresh downtrend will start then T1, T2,T3 will activate
1,3,5,10,15,20 minutes are short term levels.
30 minutes 60 minutes , 2 hours,3 hours, ... 1 day and 1 week chart positional and long term levels

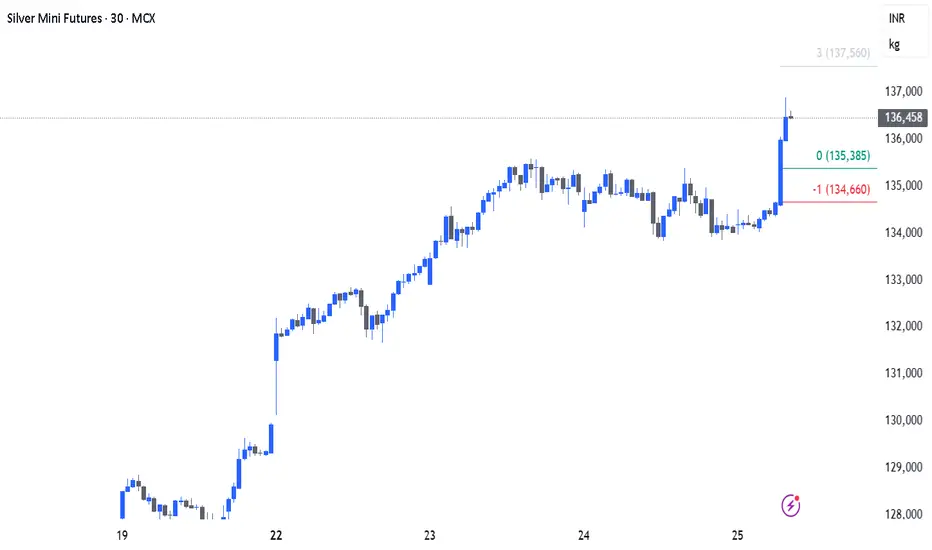
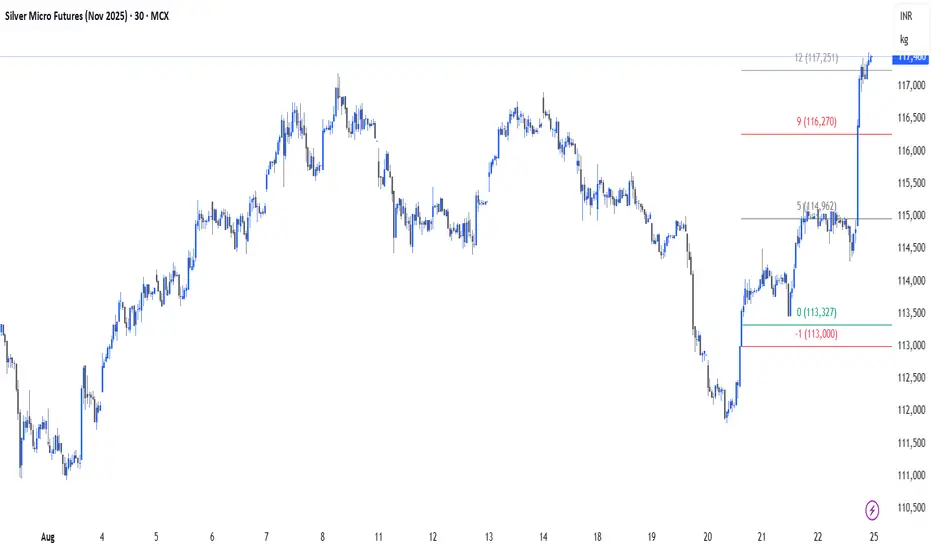
Silver Re Entry After booking partial profits at 12R, I am re-entering the MCX:SILVERM1! trade with a fresh position. The setup continues to align with my trend-following and risk parameters, and the market structure supports further upside potential.
Partial exit: 12R booked ✅
New entry: Initiated as per strategy rules
Risk management: Strict stop in place, position sizing aligned with capital
Targets: Following original R-multiple framework
Staying disciplined and letting the trade run with the trend.
Silver - Trade PlanCritical levels marked for a potential long setup.
Keep an eye on these zones for a possible entry.
Trade safe, manage risk.

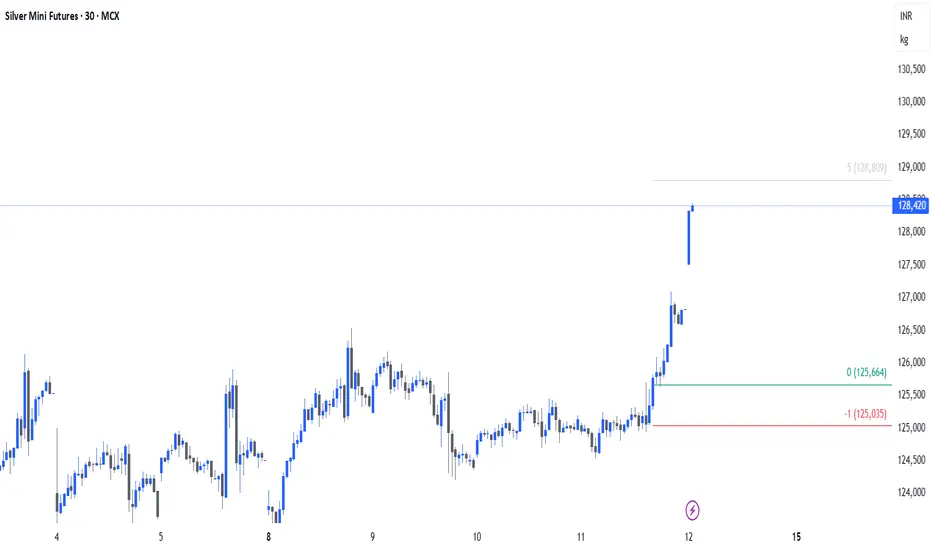
Silver – Riding the WaveMCX:SILVERMIC1! is trending strong, and we are already surfing at 5R.
Our system’s strength lies in catching mean reversals early and riding the momentum that follows.
Disciplined risk, precise trailing, no second-guessing.
This approach has delivered consistent double-digit “R” trades in the past.
Now, the trend is in motion — and we stay with it as long as it runs.
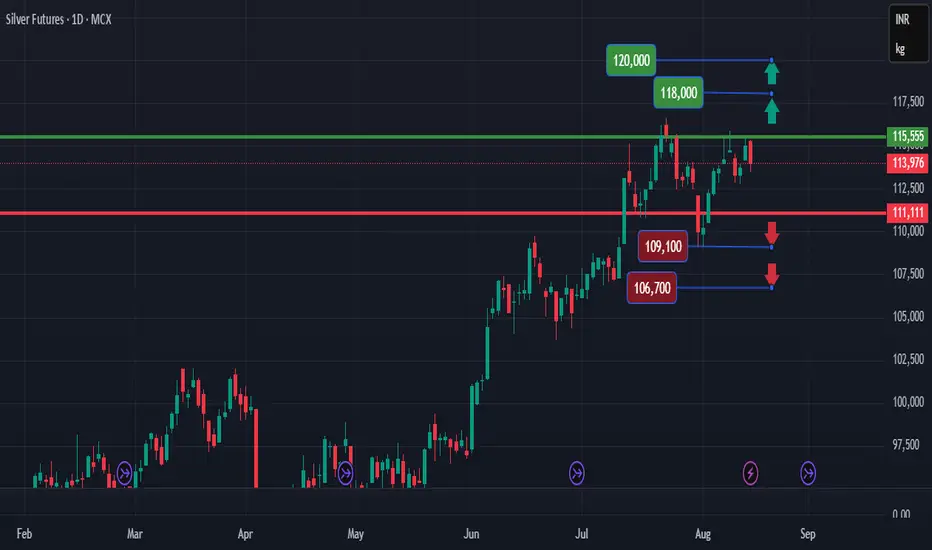
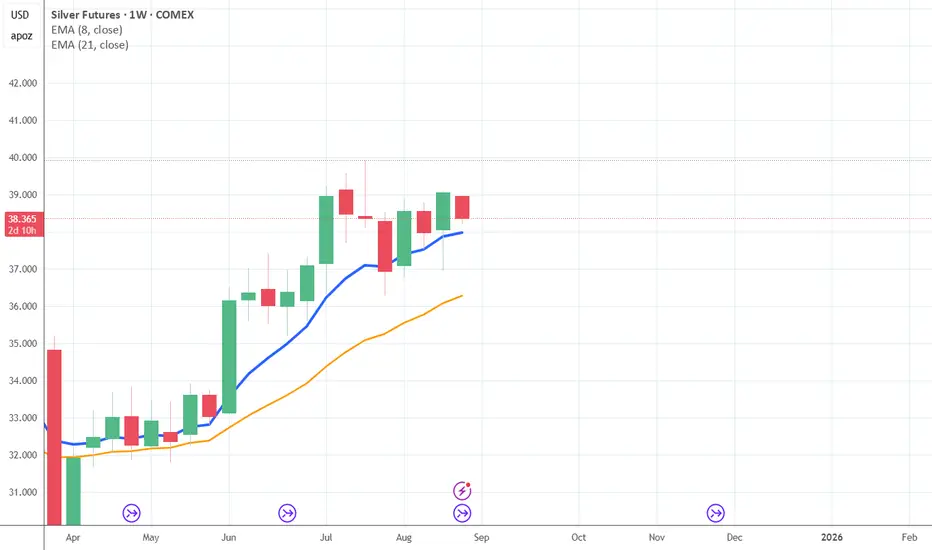
SILVERM1! - At the ResistanceCMP: 112800
TF: Weekly
Price is hitting the resistance on weekly chart, and the breakout from here might be a challenging task for the bulls. Let's see how this week progresses
Disclaimer: I am not a SEBI registered Analyst and this is not a trading advise. Views are personal and for educational purpose only. Please consult your Financial Advisor for any investment decisions. Please consider my views only to get a different perspective (FOR or AGAINST your views). Please don't trade FNO based on my views. If you like my analysis and learnt something from it, please give a BOOST. Feel free to express your thoughts and questions in the comments section.

$MCX:GOLDTENU2025 – Back in the GamePrevious trade closed at a stellar 29R.
Now re-entered MCX:GOLDTENU2025 with fresh momentum.
Risk controlled, structure intact.
No predictions, just rule following.
Stops in place, trend will decide.
Let’s see how this one unfolds.
Silver goes to the moon
Silver is entering a strong upcycle, indicating that the broader script remains firmly in the bullish zone. After consolidating around the $41.20–41.40 support range, the price has not only absorbed selling pressure but also broken above a well-defined descending trendline, which had previously acted as a cap on the upside.
This breakout has occurred just above a key resistance zone (~$41.50), confirming strength and suggesting the start of a fresh upward leg. Volume expansion on breakout candles further validates buyer participation.
• Entry Zone: $41.50–41.55 (post trendline breakout confirmation)
• Stop Loss: $41.20 (below recent support block)
• Target 1: $41.80
• Target 2: $42.00–42.20 (upper resistance and measured move from breakout)
Confluences:
• Upcycle strength: Higher lows from the $41.20 base reflect demand absorption.
• Trendline breakout: Clean break above the descending resistance trendline signals trend reversal.
• Key zone retest: Breakout happened above $41.50, a zone of prior supply, turning it into fresh support.
• Momentum indicator (bottom panel): Rebounding sharply from oversold, confirming bullish momentum.
Bias: Strongly bullish as long as $41.20 support holds. Sustained trade above $41.55 can accelerate the move toward $42+.

MCX Silver Ready For Big Dhamaka - Neal Bhai ReportsMCX Silver Prices Ready For Big Dhamaka, What you think up or down? - Neal Bhai Reports
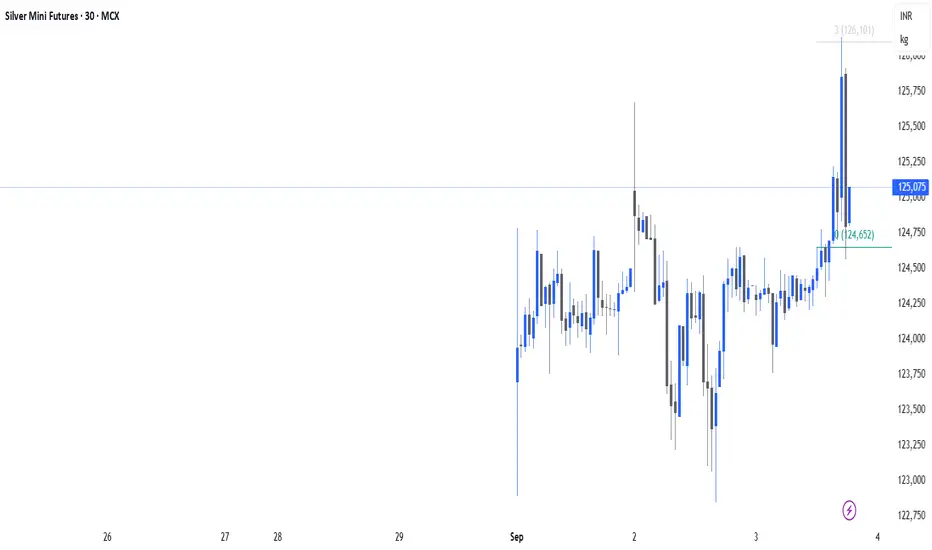
Silver Reversal In PlayLast trade delivered 12R.
Now positioned again in MCX:SILVERMIC1! .
Reversal signs clear, momentum building.
Risk defined, rules followed, no guessing.
Stops trail, trend decides.
Let’s see where this one runs.

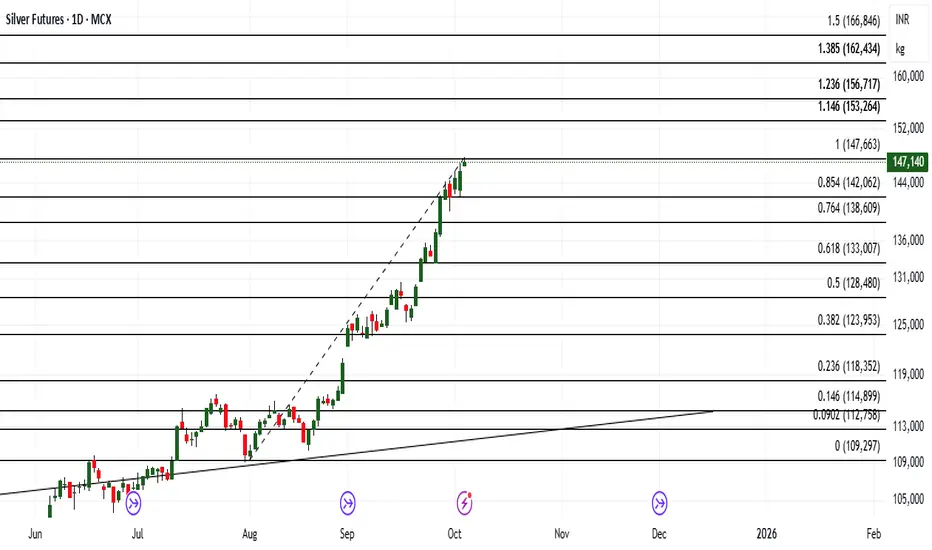
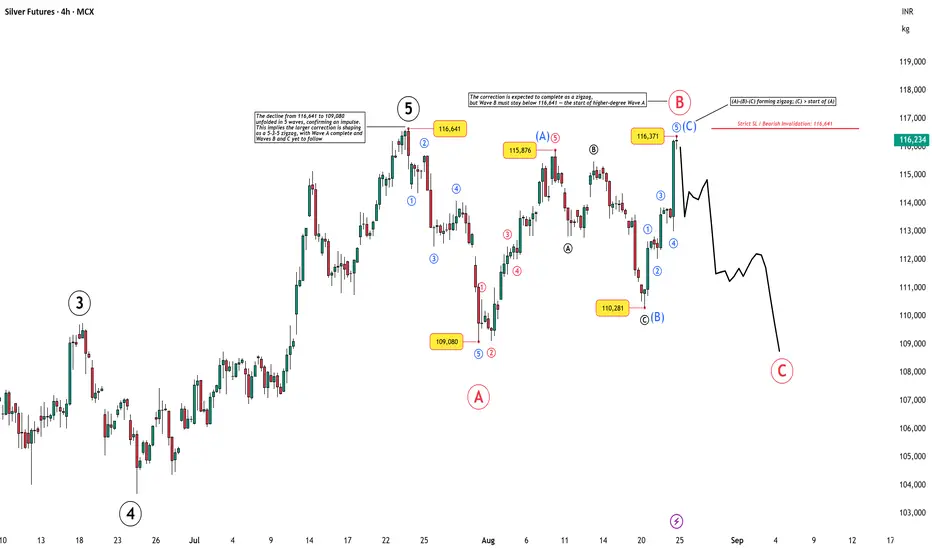
Silver Futures (4H) – Zigzag Correction in ProgressThe decline from 116,641 → 109,080 unfolded in 5 waves, confirming an impulse. This sets the stage for a 5-3-5 zigzag correction . With Wave A complete, the market is now advancing in Wave B, expected to resolve as a zigzag.
A strict bearish invalidation level is marked at 116,641 . As long as prices remain below this level, the expectation is for Wave C down to follow and complete the zigzag sequence.
📌 Key Levels:
Invalidation (SL): 116,641
Wave B unfolding as zigzag
Wave C down expected next
Disclaimer: This analysis is for educational purposes only and does not constitute investment advice. Please do your own research (DYOR) before making any trading decisions.
12R locked in on $MCX:SILVERMIC1!12R locked in on MCX:SILVERMIC1!
I entered with conviction, managed with discipline.
Risk was tight, exits were clear, emotions silent.
Price moved, I trailed. Trend built, I rose with it.
No rush, no greed — just system and patience.
This is sigma trading: controlled risk, amplified reward.
Silver good to long.Silver is trending in uptrend in weekly timeframe. Geopolitical tension will give spur to silver. I think its very good opportunity to long silver above last weeks high.
SILVER,silver look more bullish till 113550 to 114000 ++silver retrace 112300 to 112000,wait retrace dip buy

Silver still more fall possible 700-800 points avoid any buySilver holding sell trade from 113550 , still more fall possible of 700-800 points avoid any buy trade, safe traders can book profit now also ,since fall will come on comex but mcx may be not open tomorrow morning that also possible
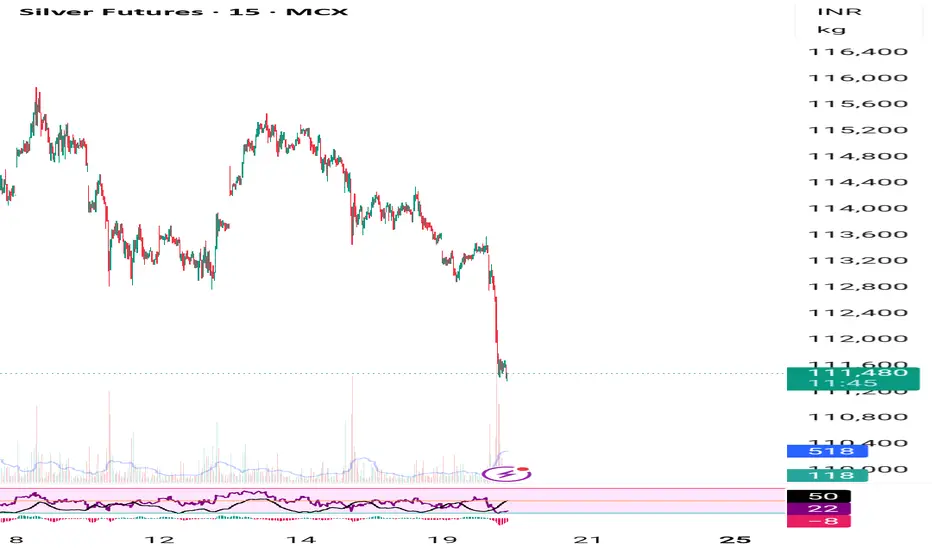
Silver holding sell trade from 113550-113600 , sl 114500Silver we are holding sell trade from 113550 .
Until 114500 not break sell on rise will continue.
Downside target 112800, 112100, 111500, 110900
How My Harmonic pattern projection Indicator work is explained below :
Recent High or Low :
D-0% is our recent low or high
Profit booking zone ( Early / Risky entry) : D 11.8% -D 16.1 % is
range if break them profit booking start on uptrend or downtrend but only profit booking, trend not changed
SL reversal zone (Safe entry ) : SL 23% and SL 25% is reversal zone if break then trend reverse and we can take reverse trade
Target : T1, T2, T3, T4 and .
Are our Target zone
Any Upside or downside level will activate only if break 1st level then 2nd will be active if break 2nd then 3rd will be active.
Total we have 7 important level which are support and resistance area
Until , 16% not break uptrend will continue if break then profit booking will start.
If break 25% then fresh downtrend will start then T1, T2,T3 will activate
1,3,5,10,15,20 minutes are short term levels.
30 minutes 60 minutes , 2 hours,3 hours, ... 1 day and 1 week chart positional and long term levels
