$MNT - breakout and onto newer highsTSX:MNT at its current levels & especially, its chart - is a great study to notice patterns for break outs in coins that have not yet pumped. TSX:MNT sentiment is that it does have more upside, having said that - this would be a great study to follow up on other coins that are yet to surge with s
Related pairs

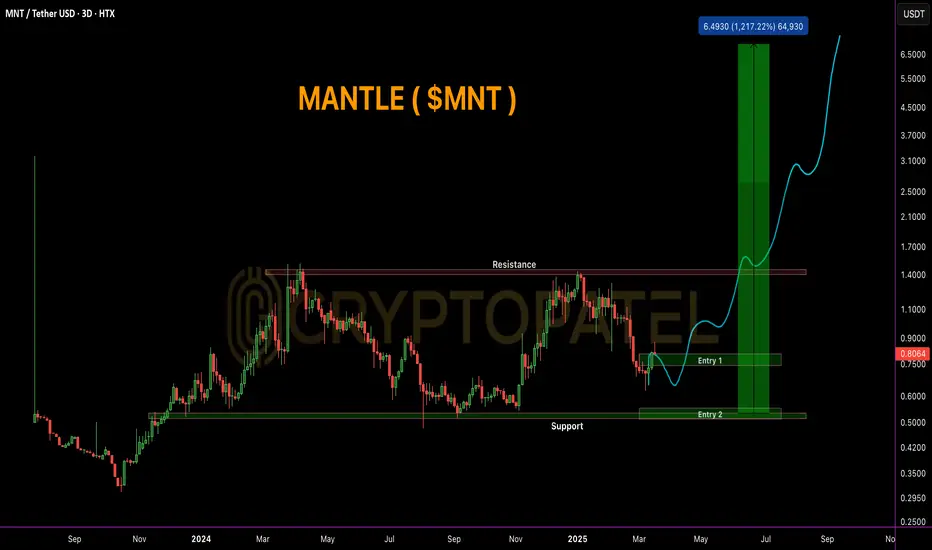
$MNT Technical Analysis – Road to $8? 🚨 TSX:MNT Technical Analysis – Road to $8? 🚨
🔹 Market Sentiment: High potential in #Altseason with TSX:MNT being a key contender. Likely $TRUMP's World Liberty Pick, adding more bullish conviction.
🔹 Best Accumulation Zones:
📍 Entry 1: $0.80 - $0.70
📍 Entry 2: $0.55 - $0.50
🔹 Targets:
✅ $1.40
Will The MNT Price Stagnation Continue Further?Mantle has a market cap of $3.22 Billion and is ranked 35th in the CMC. The VM ratio of the token price is at 0.01 while the volume has seen a decline of 23% in the intraday session. MNT token price is currently trading near the value of $0.98 with a drop of 1% in the intraday session.
The token pri

Will MNT Token Price See A Comeback Soon?Mantle network has a market cap of $3.2 Billion and is ranked 31st in the cryptoverse. MNT token has a supply of 6,219,316,795 MNT and has 52.4% circulating in the market. The token is currently trading near the value of $1.01 with a drop of 1.5% in the intraday session.

MNTUSDT#BYBIT #KUCOIN #GATE.IO
MANTLE breakout done looking bullish you can take trade
Entry At 0.654
1st target 0.71
2nd target : 0.74
2nd target 0.8
STOP below 0.62
#DYOR #NFA

See all ideas
Summarizing what the indicators are suggesting.
Oscillators
Neutral
SellBuy
Strong sellStrong buy
Strong sellSellNeutralBuyStrong buy
Oscillators
Neutral
SellBuy
Strong sellStrong buy
Strong sellSellNeutralBuyStrong buy
Summary
Neutral
SellBuy
Strong sellStrong buy
Strong sellSellNeutralBuyStrong buy
Summary
Neutral
SellBuy
Strong sellStrong buy
Strong sellSellNeutralBuyStrong buy
Summary
Neutral
SellBuy
Strong sellStrong buy
Strong sellSellNeutralBuyStrong buy
Moving Averages
Neutral
SellBuy
Strong sellStrong buy
Strong sellSellNeutralBuyStrong buy
Moving Averages
Neutral
SellBuy
Strong sellStrong buy
Strong sellSellNeutralBuyStrong buy
Frequently Asked Questions
The current price of MNT / UST (MNT) is 1.69660000 USDT — it has fallen −1.75% in the past 24 hours. Try placing this info into the context by checking out what coins are also gaining and losing at the moment and seeing MNT price chart.
MNT / UST price has risen by 1.86% over the last week, its month performance shows a 36.40% increase, and as for the last year, MNT / UST has increased by 34.26%. See more dynamics on MNT price chart.
Keep track of coins' changes with our Crypto Coins Heatmap.
Keep track of coins' changes with our Crypto Coins Heatmap.
MNT / UST (MNT) reached its highest price on Sep 23, 2025 — it amounted to 1.87320000 USDT. Find more insights on the MNT price chart.
See the list of crypto gainers and choose what best fits your strategy.
See the list of crypto gainers and choose what best fits your strategy.
MNT / UST (MNT) reached the lowest price of 1.09000000 USDT on Sep 4, 2025. View more MNT / UST dynamics on the price chart.
See the list of crypto losers to find unexpected opportunities.
See the list of crypto losers to find unexpected opportunities.
The safest choice when buying MNT is to go to a well-known crypto exchange. Some of the popular names are Binance, Coinbase, Kraken. But you'll have to find a reliable broker and create an account first. You can trade MNT right from TradingView charts — just choose a broker and connect to your account.
MNT / UST (MNT) is just as reliable as any other crypto asset — this corner of the world market is highly volatile. Today, for instance, MNT / UST is estimated as 3.21% volatile. The only thing it means is that you must prepare and examine all available information before making a decision. And if you're not sure about MNT / UST, you can find more inspiration in our curated watchlists.
You can discuss MNT / UST (MNT) with other users in our public chats, Minds or in the comments to Ideas.