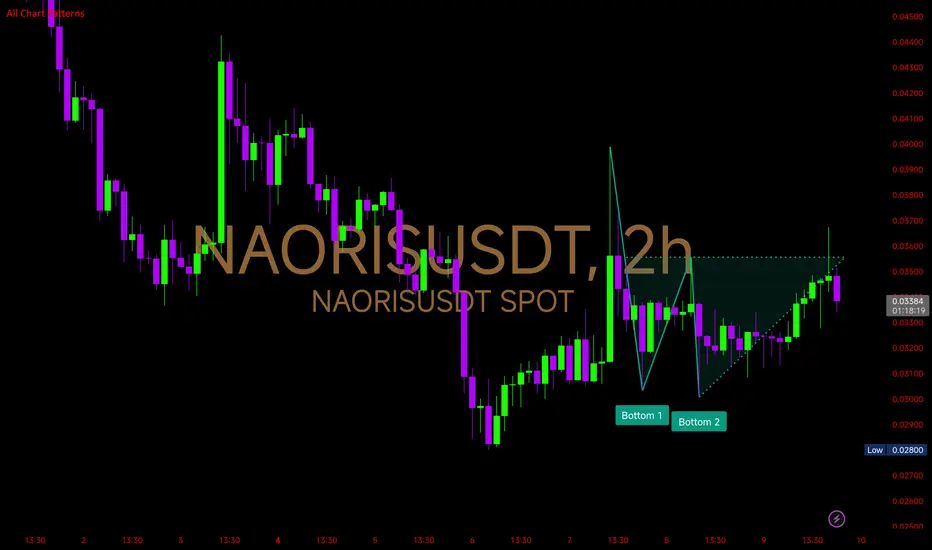
$NAORIS – Double Bottom Formation $NAORIS – Double Bottom Formation
The 2Hr chart is showing a Double Bottom pattern — a classic bullish reversal signal that forms after extended downtrends, indicating sellers are losing momentum and buyers are stepping in.
🔸Bottom 1 (~0.0308): First rejection after a steep decline, signaling ini

$AIO 1Hr Chart Analysis NYSE:AIO 1Hr Chart Analysis
Chart is showing a well-defined Falling Wedge — a bullish reversal pattern that forms as price makes lower highs and lower lows, but within converging trendlines. This typically signals selling pressure is weakening and a potential breakout is brewing.
🔸The wedge form
See all ideas
Summarizing what the indicators are suggesting.
Oscillators
Neutral
SellBuy
Strong sellStrong buy
Strong sellSellNeutralBuyStrong buy
Oscillators
Neutral
SellBuy
Strong sellStrong buy
Strong sellSellNeutralBuyStrong buy
Summary
Neutral
SellBuy
Strong sellStrong buy
Strong sellSellNeutralBuyStrong buy
Summary
Neutral
SellBuy
Strong sellStrong buy
Strong sellSellNeutralBuyStrong buy
Summary
Neutral
SellBuy
Strong sellStrong buy
Strong sellSellNeutralBuyStrong buy
Moving Averages
Neutral
SellBuy
Strong sellStrong buy
Strong sellSellNeutralBuyStrong buy
Moving Averages
Neutral
SellBuy
Strong sellStrong buy
Strong sellSellNeutralBuyStrong buy