IXIC completed it Fibonacci RetracementIn a strong uptrend, price retrace up to 38.2 and if it take support at that level then we can see strong bounce.
CwC
IXIC trade ideas

BUY in DIPS & SELL IN RESISTANCEBuy in dips , sell in resistance ..Until volatility is cooled off...

Nasdaq Daily: Ideal reversal Nasdaq daily: Reversed right from key Fibo level / +Ve RSI divergence / possibly end of 5. Keep eyes...

Nasdaq - BreakdownAfter cautioning when the Nasdaq broke below the 200EMA..its now headed for a H&S breakdown..
Its time to be very cautious and hold back from buying every dip until all global markets show signs of bottoming out.
Note: The Nasadaq has given up ALL its 2021 gains.

NasdaqIn a correction and gap fill...NAS Respecting fibonacci on weekly charts
#LongtermBullish #Investors
heading towards a timewise correction in coming weeks
Closing above 15200 and sustaining will invalidate this...
0.618 would be crucial buy there for Huge run!


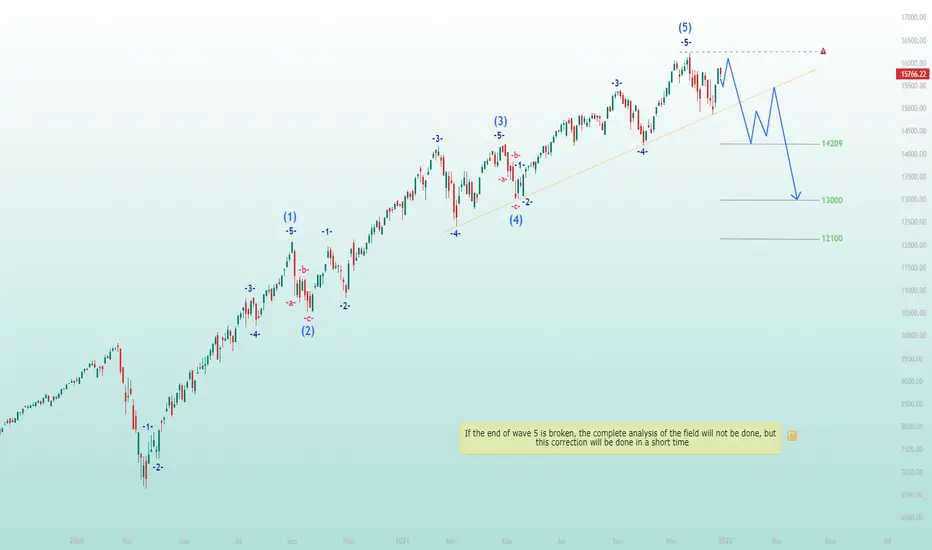
Nasdaq (IXIC) | The best scenario for the fallHello traders, Nasdaq (IXIC) in daily timeframe , this analysis has been prepared in daily timeframe but has been published for a better view in 2 day timeframe.
By looking at the waves, Waves 1 and 2 are probably over at weekly time, and this analysis and this wave count is part of Wave 3.
Wave 3 that we are talking about is not on the Fibonacci in the weekly time that can be reversed, and only we considered this correction by counting the wave in the daily time.
In daily time, waves 1 and 2 are complete and wave 3 is in excellent condition in terms of appearance, but it is not in good shape relative to wave 1.
Waves 2 and 4 are very similar both in appearance and correction, causing the wave count to be not normal.
However, there are exceptions in the waves.
We gave the possibility of correction, provided that the trend line is completely broken, and now this failure has taken place to some extent.
We determine the nature of this correction and this wave after completion, but in the first movement of this wave, I think the movements occur in the form of five waves.
If the end of wave 5 is broken, the complete analysis of the field will not be done, but this correction will be done in a short time.
🙏If you have an idea that helps me provide a better analysis, I will be happy to write in the comments🙏
❤️Please, support this idea with a like and comment!❤️

Nasdaq (IXIC) | The best scenario for the fallHello traders, Nasdaq (IXIC) in daily timeframe , this analysis has been prepared in daily timeframe but has been published for a better view in 2 day timeframe.
By looking at the waves, the weekly times 1 and 2 are probably over, and this analysis and this wave count is part of wave 3.
Wave 3 that we are talking about is not on the Fibonacci in the weekly time that can be reversed, and only we considered this correction by counting the wave in the daily time.
In daily time, waves 1 and 2 are complete, and wave 3 is in excellent condition in terms of appearance, but it is not in good shape relative to wave 1.
Waves 2 and 4 are very similar both in appearance and correction, making the wave count not normal.
However, there are exceptions in the waves.
We correct the probability provided that the trend line and the red circle are completely broken.
If the end of wave 5 is broken, the complete analysis of the field will not be done, but this correction will be done in a short time.
🙏If you have an idea that helps me provide a better analysis, I will be happy to write in the comments🙏
❤️Please, support this idea with a like and comment!❤️

NASDAQ 100My nasdaq target is around 18110 for upside then there will be some pull back until it break 14900 levels in the downside.

Nasdaq (IXIC) | The best scenario for the fallHello traders, Nasdaq (IXIC) in daily timeframe , this analysis has been prepared in daily timeframe but has been published for a better view in 2 day timeframe.
By looking at the waves, the weekly times 1 and 2 are probably over, and this analysis and this wave count is part of wave 3.
Wave 3 in the weekly time is not on the Fibonacci that can be returned, and only we can make this correction with the wave count we considered in the daily time.
In daily time, waves 1 and 2 are complete and wave 3 is in excellent condition in terms of appearance, but it is not in good shape relative to wave 1.
Waves 2 and 4 are very similar both in appearance and correction and have caused the wave count to not be normal.
However, there are exceptions in the waves.
We make the possibility of correction provided that the trend line is broken downwards and the price will move up to the specified targets.
If the end of wave 5 is broken, the complete analysis of the field will not be done, but this correction will be done in a short time.
🙏If you have an idea that helps me provide a better analysis, I will be happy to write in the comments🙏
❤️Please, support this idea with a like and comment!❤️
Nasdaq - Took Channel Support1. Trading inside Channel
2. Took Channel Support
3. Weekly Closing above 15350 may consider as bull run continuation

1. Channel Support, 2. Previous All time high act as Support1. Channel Support
2. Previous All time high act as Support

NASDAQ Primed for a BounceUnless the Evergrande Crisis and/or the US Debt Ceiling issue ends up blowing in everybody's face, NASDAQ (IXIC) is looking primed for a bounce here.

IXIC Bull Trend biggest player entry IXIC
1. rising wedge pattern price up side move
2. take good support for support line
3. next expect target coming soon.....................

IXIC Bullish Trend IXIC
1. rising wedge pattern price up side move
2. take good support for support line
3. next expect target coming soon.....................


IXIC (June 15, 2021) SignalsCould be an end of Bull Run?
Indicators are Recommending the Price Action to move Down.
IXIC is getting extreme momentum which is too dangerous for Nasdaq at this level.
Sudden Increase in Volume, Volatility, Momentum, Liquidity is dangerous for NASAQ health.
RSI is Almost at an Overbought level.
Stochastic RSI is at Overbought Level.
CCI is on its way ahead to crack the overbought level.
Extremely Bearish Strength for June 15, 2021. NASDAQ:IXIC
Expecting a 53 Points Down from the Opening.
Thanks for using your Valuable time. Leave a like which helps me to do better. Follow me for Daily Signals,
Get updates on, FOREX, Stocks, INDICES, Crypto, #--CFD's to be expected soon. (Share to your Market Friends)

NASDAQ COMPOSITE (Signals) [June 14]IXIC to the Ground
IXIC is making a Momentum to maintain the Volatility
Candle Stick patterns shows that there are more buyers in the market. Large Body Candles.
There are some levels marked in the chart.
These levels are considered as Pivot Points and S&R.
14,072 and 14,009 and 14,016 and 14,048. The Crucial Levels for June 14 mark it on your chart.
The Overall Strength is Bearish.
Expecting a +17 Points Up from the Opening and -39 Points Down from +17 Points.
Thanks for using your Valuable time. Leave a like which helps me to do better. Follow me for Daily Signals,
Get updates on, FOREX, Stocks, INDICES, Crypto, #--CFD's to be expected soon. (Share to your Market Friends)


WILL NASDAQ fall lead to Indian index correction ? NASDAQ after re-testing its ATH countered a profit booking in the last week, Indian markets also remained volatile looking for directions from global markets
Now that NASDAQ has broken its trend line, support zone and expected to fall at least for a couple of days, How would Indian markets react
the movement of NASDAQ happens outside of Indian trading hours, so any downside in NASDAQ is usually factored as GAP DOWNS or GAP UPS.
GAP DOWN expected, and one more GAP DOWN Tomorrow can't be ruled out looking at price action of NASDAQ
This is curtailed week for Indian trading, so expect volatility and premiums would be vaporised like anything if you are an option buyer and caught on the wrong side.
selling NIFTY OTM CE would be a safer option
Trade Safe

nasdaq clearly broken H&S necklinenasdaq broken from the neckline of H&S clearly and indicating weakness.
with this index have broken long term rising channel.

Nasdaq - CautionH&S chart on the daily charts..If it breaks in the next day or 2 it could hurt our markets too. This was the index which was leading American markets over the last couple years with the FAANG stocks + Microsoft + Tesla.
Watch this space closely to dictate the direction of global markets. So far the Dow Jones is holding its own and out performing the Nasdaq but we need to keep a close eye on this space.
