Adani Enterprises LtdDate 18.12.2025
Adani Enterprises
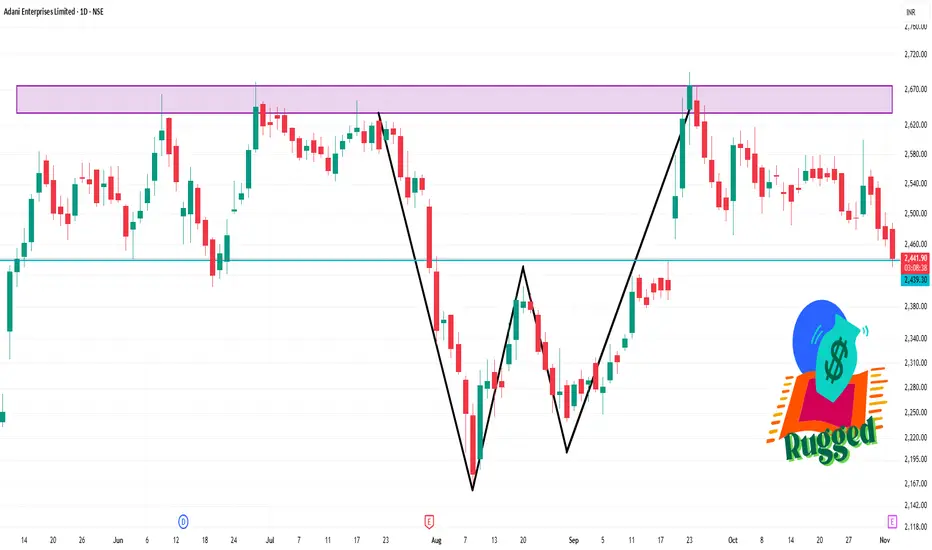
Timeframe : Day Chart
Technical Representaion :
(1) Stock has formed bearish inverted cup & handle pattern
(2) Neckline is 2100-2050 is a make or break area/zone
(3) Below neckline is breakdown & target is open
(4) Stock is already trading below 200 exponent
Next report date
—
Report period
—
EPS estimate
—
Revenue estimate
—
65.80 INR
70.99 B INR
978.67 B INR
370.34 M
About Adani Enterprises Limited
Sector
Industry
CEO
Rajesh Shantilal Adani
Website
Headquarters
Ahmedabad
Founded
1988
Identifiers
2
ISININE423A01024
Adani Enterprises Ltd. engages in the business of integrated infrastructure and trading activities. It operates through the following segments: Integrated Resource Management, Mining, New Energy Ecosystem, Airport, Road, and Others. The company was founded by Gautambhai Shantilal Adani in 1988 and is headquartered in Ahmedabad, India.
Related stocks

Part 1 Candle Stick Patterns How Traders Use Options
a. Directional Trading
Buying call/put based on expected movement.
Example:
If NIFTY is bullish → Buy Call
If NIFTY is bearish → Buy Put
b. Non-Directional Trading
Option sellers earn money when the market stays in a range.
c. Breakout Trading
Buy options during break

#ADANIENT – Massive Head & Shoulders Breakdown Loading?ADANIENT is completing a major weekly H&S pattern 👤, with price sliding toward the neckline.
It’s now sitting on the critical support zone: 1966–2078 ⚠️
A WCB below this zone can trigger a 50%+ fall, potentially revisiting the previous lows below 1000 📉 💣
Trend stays weak unless it reclaims 2614

Adani Enterprises – Bullish Reversal from Channel SupportAnalysis & Viewpoint:
Adani Enterprises has been moving inside a well-defined ascending channel for more than one year. The price recently corrected toward the lower demand zone and has taken support exactly at the rising trendline, indicating that buyers are still defending the structure.
The lat

ADANIENT - Range Support Retest near 2280💹 Adani Enterprises Ltd (NSE: ADANIENT)
Sector: Conglomerate | CMP: 2280.00 | View: Range Support Retest near 2280
ADANIENT spent the day moving weakly, and the price behaviour was fairly simple to understand. The stock opened soft, tried to move up for a short while, but sellers stepped in around

ADANIENT - Eying 2700 on this corrective rise?
TF: Daily
CMP: 2462
From the lows at 1964, The swings are overlapping, making it a corrective move/structure overall.
This leg appears to be the Y wave up in the corrective WXY rise and could potentially reach 2700-2750 levels. Just so you know/observe, The zone also happens to be the confluence

Adani Enterprises Shares Jump After Fundraising - Chart AnalysisAdani Enterprises Limited – Technical Chart Analysis and Stock Update (November 2025)
Adani Enterprises shares surged by more than six percent today as investor sentiment turned positive following the company’s announcement of a massive Rs 24,930 crore rights issue.
This move marks the company’s

ADANIENT 1 Day Time Frame ✅ Important Levels
From the pivot-point and support/resistance calculations:
Pivot (Classic) ≈ ₹ 2,448.43
Resistance levels: ≈ ₹ 2,466.16 (R1) / ₹ 2,493.93 (R2)
Support levels: ≈ ₹ 2,420.66 (S1) / ₹ 2,402.93 (S2)
🧭 What to watch in the near term
a) If price breaks above ₹2,466-2,493 and holds
Trading Psychology and Emotional Discipline1. Understanding Trading Psychology
Trading psychology refers to the mental and emotional aspects that influence trading decisions. Every trade triggers a mix of emotions — fear, greed, hope, frustration, or excitement. These emotions can cloud judgment, making traders deviate from their plans.
Eve

Advanced Hedging Strategies1. Understanding Advanced Hedging
At its core, hedging is a risk management technique that involves taking an offsetting position in a related asset to counterbalance potential losses. Advanced hedging, however, goes beyond simple protection. It focuses on optimizing risk-reward ratios, using deriv
See all ideas
Summarizing what the indicators are suggesting.
Neutral
SellBuy
Strong sellStrong buy
Strong sellSellNeutralBuyStrong buy
Neutral
SellBuy
Strong sellStrong buy
Strong sellSellNeutralBuyStrong buy
Neutral
SellBuy
Strong sellStrong buy
Strong sellSellNeutralBuyStrong buy
An aggregate view of professional's ratings.
Neutral
SellBuy
Strong sellStrong buy
Strong sellSellNeutralBuyStrong buy
Neutral
SellBuy
Strong sellStrong buy
Strong sellSellNeutralBuyStrong buy
Neutral
SellBuy
Strong sellStrong buy
Strong sellSellNeutralBuyStrong buy
Displays a symbol's price movements over previous years to identify recurring trends.
Frequently Asked Questions
The current price of ADANIENT is 2,248.00 INR — it has decreased by −0.65% in the past 24 hours. Watch Adani Enterprises Limited stock price performance more closely on the chart.
Depending on the exchange, the stock ticker may vary. For instance, on NSE exchange Adani Enterprises Limited stocks are traded under the ticker ADANIENT.
ADANIENT stock has fallen by −0.93% compared to the previous week, the month change is a −8.21% fall, over the last year Adani Enterprises Limited has showed a −1.59% decrease.
We've gathered analysts' opinions on Adani Enterprises Limited future price: according to them, ADANIENT price has a max estimate of 2,990.00 INR and a min estimate of 2,940.00 INR. Watch ADANIENT chart and read a more detailed Adani Enterprises Limited stock forecast: see what analysts think of Adani Enterprises Limited and suggest that you do with its stocks.
ADANIENT reached its all-time high on Dec 21, 2022 with the price of 4,064.00 INR, and its all-time low was 5.70 INR and was reached on Sep 20, 2006. View more price dynamics on ADANIENT chart.
See other stocks reaching their highest and lowest prices.
See other stocks reaching their highest and lowest prices.
ADANIENT stock is 1.06% volatile and has beta coefficient of 1.59. Track Adani Enterprises Limited stock price on the chart and check out the list of the most volatile stocks — is Adani Enterprises Limited there?
Today Adani Enterprises Limited has the market capitalization of 2.93 T, it has decreased by −2.34% over the last week.
Yes, you can track Adani Enterprises Limited financials in yearly and quarterly reports right on TradingView.
Adani Enterprises Limited is going to release the next earnings report on Jan 29, 2026. Keep track of upcoming events with our Earnings Calendar.
Adani Enterprises Limited revenue for the last quarter amounts to 212.49 B INR, despite the estimated figure of 261.09 B INR. In the next quarter, revenue is expected to reach 259.14 B INR.
ADANIENT net income for the last quarter is 31.99 B INR, while the quarter before that showed 7.34 B INR of net income which accounts for 335.55% change. Track more Adani Enterprises Limited financial stats to get the full picture.
Yes, ADANIENT dividends are paid annually. The last dividend per share was 1.30 INR. As of today, Dividend Yield (TTM)% is 0.06%. Tracking Adani Enterprises Limited dividends might help you take more informed decisions.
Adani Enterprises Limited dividend yield was 0.06% in 2024, and payout ratio reached 2.10%. The year before the numbers were 0.04% and 4.57% correspondingly. See high-dividend stocks and find more opportunities for your portfolio.
As of Dec 24, 2025, the company has 14.22 K employees. See our rating of the largest employees — is Adani Enterprises Limited on this list?
EBITDA measures a company's operating performance, its growth signifies an improvement in the efficiency of a company. Adani Enterprises Limited EBITDA is 137.68 B INR, and current EBITDA margin is 15.07%. See more stats in Adani Enterprises Limited financial statements.
Like other stocks, ADANIENT shares are traded on stock exchanges, e.g. Nasdaq, Nyse, Euronext, and the easiest way to buy them is through an online stock broker. To do this, you need to open an account and follow a broker's procedures, then start trading. You can trade Adani Enterprises Limited stock right from TradingView charts — choose your broker and connect to your account.
Investing in stocks requires a comprehensive research: you should carefully study all the available data, e.g. company's financials, related news, and its technical analysis. So Adani Enterprises Limited technincal analysis shows the sell today, and its 1 week rating is sell. Since market conditions are prone to changes, it's worth looking a bit further into the future — according to the 1 month rating Adani Enterprises Limited stock shows the sell signal. See more of Adani Enterprises Limited technicals for a more comprehensive analysis.
If you're still not sure, try looking for inspiration in our curated watchlists.
If you're still not sure, try looking for inspiration in our curated watchlists.