APOLLOHOSP trade ideas


[Buddha] APOLLOHOSP Inside Bar TradeLong if it breaks the high of the previous day with a stop loss at the previous day's low.
Short if it breaks the low of the previous day with a stop loss at the previous day's high.
In case of gap up above the previous day's high or gap down below the previous day's low, please avoid buying it or selling it respectively. Follow the ending of the candle formed in first 5 minutes and follow ORB strategy.

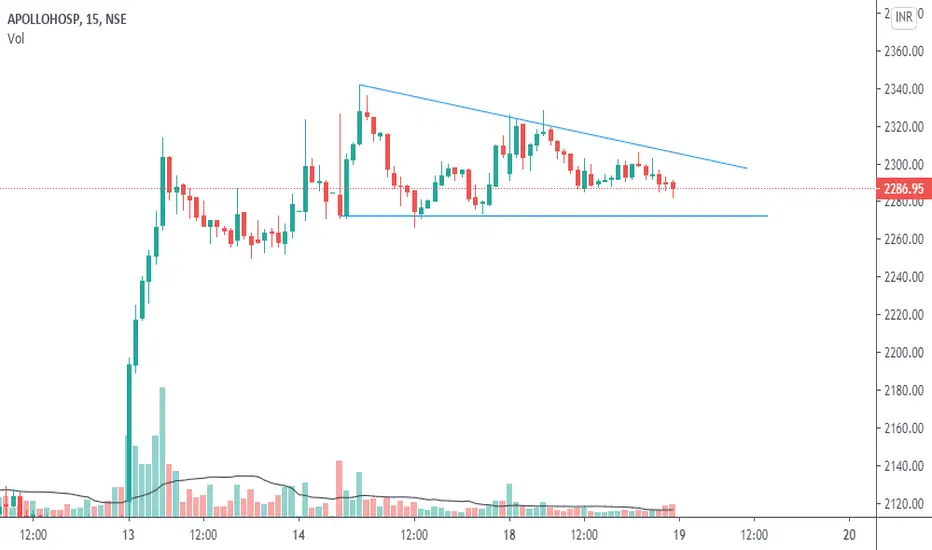
Apollo Hospitals intraday+Swing ideaAnother bull flag spotted
Apollo hospitals
as per option chain analysis, 2300 level will act as support. so as long as it stays above 2300, it is bullish to me.
buy on flag breakout


Apollo hospital - If breaks 2825 is the target !!Previously price made a double top and after a small rejection we have seen the super bullish move till 2330 levels.
Price once again making double top and this time there wont be any rejection, it may directly break the levels and will reach 2825 levels as per Fibonacci analysis.
One must wait for the price to close above ATH and look for the target.
If you find my analysis helpful . . . . . Please show your support by hitting 👍 LIKE button,
Your Support is very much 🙏 appreciated!

Apollo Hospital at Critical ZoneApollo Hospitals is at critical Zone that can lead to either
1. A Double Top for a reversal (Short Trade)
2. A Breakout for a Long Trade
Keep Watching. Wait for price action at this juncture to take your trade!


Apollo hospital fibo retracement Go short and other details are on diagram, exit when trend reverse on any fibo...


Apollo hospital long CMP 1421 / TGT 1806 / SL 1350Apollo hospital long CMP 1421 / TGT 1806 / SL 1350
(HIVATM27042020)


APOLLOHOSPITAL: ALGO SELL SIGNALHOW TO FOLLOW ALGO SIGNAL:
Deciding buy/sell
1.Strictly use only on 1 hour time frame.
2.Wait for a ‘X’ sign before mind make up. A red ‘X’ means look for selling opportunity , a green ‘X’ means look for buying opportunity.
Taking a position:
3.Wait for an arrow before entering into any position. A red arrow on upside of a bar pointing downward means open short position. A green arrow below the bar pointing upward means open buy position.
4.NOTE: Only after the the signalling of X , look for arrow. Do not buy/sell if you see any arrow before the signal of X.
5.STOP LOSS should be the most recent swing high/low or most recent STRONG CANDLE’S high/low.
While maintaining the position :
6.The small triangles after the each bar completion tells you to hold the position. The red triangles appearing upside on the bar tells you to hold the short position, whereas the green triangles appearing below the bars tells you to hold the long position.
Exiting the position:
7.After you create a buy position , if you see a green arrow above any bar pointing downward, then you should either book partially/leave the position for sometime. You will get another signal to re-enter.
8.Similarly, after you create a sell position , if you see a red arrow below any bar pointing upward, then you should either book partially/leave the position for sometime. You will get another signal to re-enter.
9.While being in position if you see any X signal which is opposite of your trade , then leave your position immediately.
10.When you see a big red circle dot then you must exit all your short positions. Contrary , when you see a big green circle dot , you must exit all your long positions. And then wait for a X-signal.
No Trading Zone:
11.When you get frequent X-signals in green-red-green-red & that too very close, then its means that stock is going to form a range. One should wait for the range break & move away to another stock. (THIS IS WHERE YOU WILL REQUIRE A PRACTICE TO IDENTIFY THE RANGE)

Apollo Hospitals#apollohospitals... seems losing momentum... watch out for demand zone tomorrow for next direction...

Apollohospital- Direction to be decided soon.This Chart gave a breakout sometime back. Now again looking at chart it seems little interesting to me. I will post few different views that I found interesting.
Lets start with weekly chart.
A hammer on weekly chart means someone did push this stocks price up. but it may be a fake signal as well so adding to this i will show another view with the help of another tool.
If we look at this chart we will find that the retracement level has already reached 38% and the retest level is exactly at 61% of the retracement tool. This stock might come for the retest but that should be a little far away . Price Action of the chart is showing that it might want to go back up with 38% retracement level.
Let's look at the price action chart as well.
If we see the price action as i tried my best to draw it on chart we can see that this is the first time (after the fall) that price is trying to halt itself and it is trying to consolidate. But what will trigger this trade is when it breaks this consolidation either on up side or if it breaks on the down side then door will open for the retest.
I hope this might help someone to understand different scenarios of the trade.
Keep an eye ladies and gentleman. Cheers and Happy Trading.


