Asian Paint Cmp 2909 dated 13-1-2023 Hammer Candle @ downtrendAsian Paint Cmp 2909 dated 13-1-2023
1. Hammer Candle after correction of 7 %.
Buy above 2930 for target 2975-3025-3085
SL 2850
Disclaimer :
I am not a SEBI registered Analyst so please do your own Analysis before taking any action.
The above view is shared just for educational purpose.
By no means shall be responsible for any losses amounting out of it incase if any trades on it.
It is just a view, please trade at your own risk.
Trade ideas

Asian Paints AnalysisHead and shoulders pattern observed in asian paints
if breakdown is confirmed with volume
then target is 2830

Asian Paints looks good to shortAsian paints have taken multiple time support near support trendline. Both daily and Weekly timeframe sentiment is bearish , looks week below 3021, short term target 2932

Asian Paints RSI Bullish DivergenceAsian paints has created double bottom on hourly chart. Also their is RSI Bullish divergence seen. It has also given breakout above the trend line. We can go long once it break above the resistance at 2924. Target will be 3036. Keep the Stoploss at previous swing low or low of the breakout candle.


#ASIANPAINTNo Overlap on hourly basis
A difference of subtle 2 points and the stock fell from 3101 to 2958

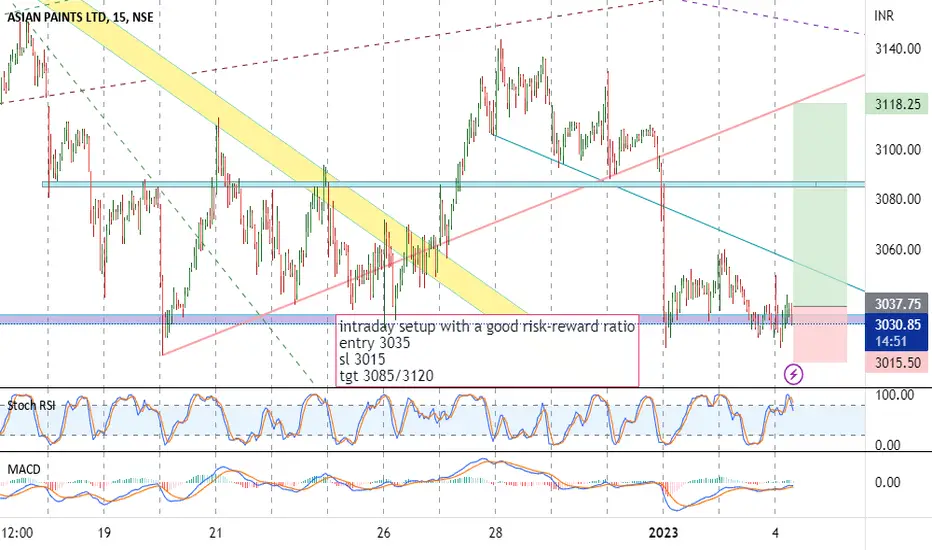
Asian Paints - intraday setupAn intraday setup with a convenient risk-reward ratio.
All levels are mentioned on the charts.
Only for learning and sharing purposes, not a piece of trading advice in any form.
All the best.
Asian PaintsAsian Paints
Reacting from trendline resistance
important support around 3039
Breakdown may give this stock momentum on downside. Keep an eye

AshianpaintInverted head and shoulder pattern developing . We can buy at dip for a higher targets. Stoploss shall be very low

Asian Paints: How to play a channelAsian Paints
The Chart set up
- Since Oct 2022 the stock has been trading in a channel
- chart is not strong but with crude prices stabilizing at lower side it favors the sector as oil is one of the major raw material.
___________________________________________________________________________________________________________________________
Trading plan
One way to trade this is : Wait for the stock to give a sustained breakout from the channel. Ideally a 3 day close beyond the channel limits should be good cue. Then play for the size of the channel in that direction (roughly 150-180 points in the direction of breakout can be looked as target in this case)
Second way to trade this
Play for a Non directional trade
The limits of the channel are roughly 3240-3244 on the upside and 3018-3030 on the downside
Given the set up, consider a short strangle strategy to start with.
Sell 3250 Call and
Sell 3000 Put
In case stock moves out of range, have a plan to Adjust your strategy to a directional one.
____________________________________________________________________________________________________________________________
Understanding reward potential and risk profile
In scenario 2:
The Strike Price chosen covers the known risk (Channel limits)
It provides a profit potential of approximately 13400 per strategy lot (approximately 11.5% ROI on margin requirement). Take advantage of time decay in case the stock stays within the range.
In addition, there is in built protection against loss for a fall up to 2933 on the downside and 3317 on the upside till 25 Jan 2023 expiry day.
This should give ample scope to adjust strategy in case stock moves out of range.
__________________________________________________________________________________________________________________________
Do let me know if you find the analysis and insights helpful.
To trade with me Like and Follow for more trading ideas like these...!!!
Take care & safe trading...!!!
Disclaimer
- The view expressed here is my personal view
- Past performance is not a guarantee for future predictions
- I have been wrong in the past and can be wrong again in future too
- Use this for educational purpose
- Any decision you take, you need to take responsibility for the same
- It's your hard earned money. Treat it wisely
- Trade / Invest keeping in mind your trading style, goals and objectives, time horizon & risk tolerance
- if trading in F&O, understand that F&O trading involves risk
- Do take proper risk management measures
- Do your own analysis and consult your financial adviser if need be


Asian Paints Cmp 3112 dated 27-12-2022 Rectangle BOAsian Paints Cmp 3112 dated 27-12-2022
1. Rectangle Consolidation BO above 3120
2. RSI Divergence
Buy above 3120 for target 3165-3200-3240
SL 3050
Disclaimer :
I am not a SEBI registered Analyst so please do your own Analysis before taking any action.
The above view is shared just for educational purpose.
By no means shall be responsible for any losses amounting out of it incase if any trades on it.
It is just a view, please trade at your own risk.

ASIANPAINT, buy or sell?NSE:ASIANPAINT looks at sweet spot to me. It's taking support around it's old levels of 3050. And on weekly timeframe if it crosses 3240 then soon 3600 levels can be seen.

ASIANPAINTS LTD.- BEARISH TREND CONTINUATIONNSE:ASIANPAINT
All important levels are marked on chart.
asian paints bearish movement.
please always use stoploss to avoid big drawdowns.
Use position sizing according to your stop loss level.
like this idea if you find it useful and please share with your friends.
keep learning,
happy trading.
Thankyou.

ASIANPAINTS seems to be taking 3rd timeNSE:ASIANPAINT is in downtrend in short term and if it breaks 3k levels then it can show 2900, 2700 & 2600 levels soon. But it would be a good buy at 2600.

Asianpaint on Short Side Asianpaint on Short Side
NSE:ASIANPAINT
Cmp 3067-70
Below Day closing of 3060
100 Points Fall is awaiting here Main support is around 3070-3100 if Bulls give up then Fall is going to happen in Asian Paints
simple Support
Resistance analysis
with Trend Analsysis

Asian Paints: Is the colour fading...!!!Asian Paints
CMP 3158
63 day EMA is at 3179
21 day EMA at 3158
Stock is struggling to sustain above 63 day EMA
Given the set up one may consider to sell Asian Paints Dec expiry 3200 Call option currently around 52
SL / Exit if closing in Spot is above 3226
Take care & safe trading...!!!
Like and share
Disclaimer
- The view expressed here is my personal view
- Past performance is not a guarantee for future predictions
- I have been wrong in the past and can be wrong again in future too
- Use this for educational purpose
- Any decision you take, you need to take responsibility for the same
- It's your hard earned money. Treat it wisely
- Trade / Invest keeping in mind your trading style, goals and objectives, time horizon & risk tolerance
- if trading in F&O, understand that F&O trading involves risk
- Do take proper risk management measures
- Do your own analysis and consult your financial adviser if need be

Asian paintsw pattern bulid chart in weekly chart
candle confrimation
rsi divergence
macd ready to green crossover
green volume come day by day

#ASIANPAINT - crawling out#ASIANPAINT - after over a month of consolidation, seems crawling out of its confined space and may be headed for some decent upwards moves. All levels mentioned on the chart and below, as well:
Enter long @ CMP 3141
SL @ 3000
Target @ 3375


[POSITIONAL] ASIANPAINT LONG BET risk: Reward ratio is 1: 2
Rest as per Charts
********
Note -
One of the best forms of Price Action is to not try to predict at all. Instead of that, ACT on the price. So, this chart tells “where” to act in “what direction. Unless it triggers, like, let’s say the candle doesn’t break the level which says “Buy/Sell if it breaks”, You should not buy/sell at all.
=======
I use shorthands for my trades.
“Positional” - means You can carry these positions and I do not see sharp volatility ahead.
“Intraday” -means You must close this position at any cost by the end of the day.
=======
Always follow a stop loss.
In the case of Intraday trades, it is mostly the “Low/High of the Candle”.
In the case of Positional trades, it is mostly the previous swings
********

Asian paint form Double Bottom patternAsian paint form Double Bottom pattern on weekly chart. It may test 3333 soon.
It can long from here and also add more if come down.
