What a move in 4 daysThat's the move we were waiting
That's how levels work
12%up move in just 2 days
EXIDEIND trade ideas


EXIDEIND - Crossing 170 decisively could push higher EXIDEIND - Strong upmove after 170 seen if another session seen with buying

Exide industries 1w Disclaimer :-
*For educational purpose only it's not a call do your own analysis.we won't be responsible for Any profit or loss.
Stock is trading in Symmetrical triangle, can go for target of T1-185 and T2-200.

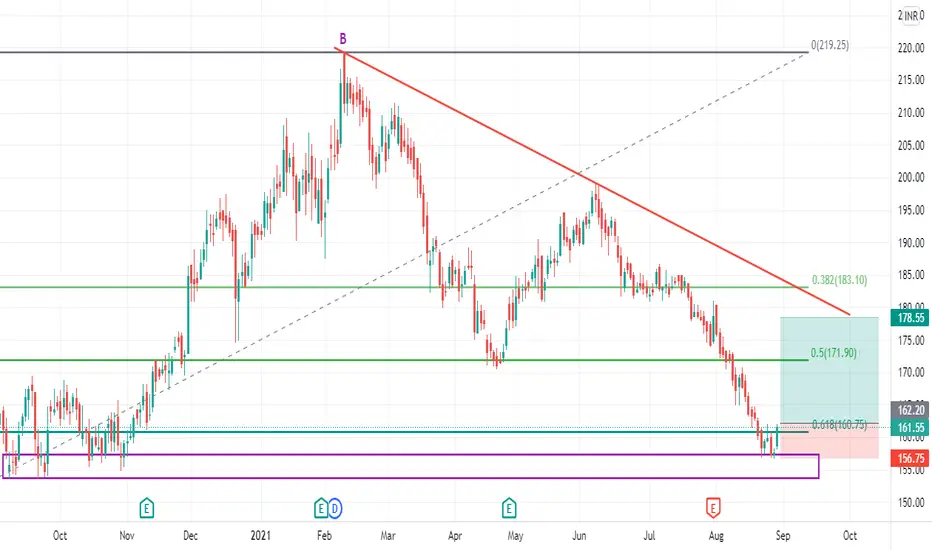
Swing Opportunity in Exide IndustriesGo Long above 162.2 for Targets of 167.65, 173.1, and 178.55 with SL 156.75
Reasons to go Long :
1. On a daily timeframe if we draw the Fibonacci retracement tool from recent swing low (point A) to recent swing high (point B) then we see stock took support from 0.618 Fibonacci level.
2. A bullish chart pattern, Double Bottom (W pattern) is formed around 0.618 Fibonacci level.
3. Also there is a strong demand zone (marked with purple color), from which the stock initially faced resistance but now is taking support and moving up.
4. The stock may go up to the trendline where it may face resistance.
Firing once it crossed the levels It was given 2 days ago and once it crossed the levels it became rocket
Journey has just started it has much more to go

EXIDE IND.Stock good for short term investments, should hold for at least 2 months.
DISCLAIMER - Analyse by yourself before investing.
Do comment and suggest if corrections needed.
HAPPY TRADING.


Reversal on CARDS KEEP adding on every deepalmost 30% correction from top now time for reversal keep adding on deep for good returns

Exide Industries Reversal
Exide Industries Reversal at 150-152
Sl Closing Basis 142
HEY TRADERS,
THIS PREDICTION IS BASED ON A HARMONIC PATTERN AND THE HARMONIC PATTERN IS 100% ACCURATE AND10000% RISKY BECAUSE IT IS AGAINST THE TREND METHOD...
HOPE YOU ALL FIND SOME VALUE Here...SO, DON'T FORGET TO LIKE AND SHARE THIS VIDEO. DON'T FORGET TO SUBSCRIBE.
COMMENTS WRITE DOWN BELOW OF THIS Chart...
THANK YOU...
~Disclaimer: All views and charts shared in this terminal are purely for knowledge and information purposes only.

EXIDE Industry is attractive at this level After retracing stock is near its demand zone zone.
This can be a really good pic for short term as well as for long term since electric vehicle are in demand
And this industry deals with battery.
AmarRaja battery is near its demand zone too.. So it's possible both of them can bounce back
If it manages to give closing above 160 then its definitely a buy signaly for us

Exide IND PRZ around 160 to 162 zoneCan see PRZ for Exide Ind at around 160 to 162
Maintain strict SL @ 149

Swing Trade Idea: Exide IndustriesSimple Price Action Analysis:
The level of 170-180 has been a strong supply and demand zone in the history of this stock. In the early years, this zone acted as heavy resistance zone. However after giving a successful breakout in 2nd half of 2017, this resistance zone was converted into support zone. This support zone was broken during previous year due to COVID crash. The stock gave a successful breakout out of these levels in the 2nd half of 2020. Now it is again acting as a support zone.
What to do?
We can buy at these levels for a target of 200 or above 200 with a strict SL of 165. This makes a RR ratio of around 1:2.5. Very safe bet.
Disclaimer:
This is not a buying recommendation. Please consult your financial advisor before taking any decision.

exide industriesthe stock is in the formation of head and shoulder pattern ....has already formed left shoulder and head and now approaching towards the formation of right shoulder ...volumes are also supporting...

EXIDEINDEXIDEIND is retracing to 61.8% Fibonacci of its previous upward trend. The RSI indicator is also very low indicating an oversell condition and possible reversal of trend. Bounce back upward from 61.8 is highly likely. With a stoploss of around 3-5%, with a target of about 254, entry @ around 161 seems like a plausible scenario. If this doesn't happen then the next entry would be 145.30

SHORT EXIDEINDIANSE:EXIDEIND
Price ne 1 diagonal head & shoulder banaya hai. jo an monthly head & shoulder complete karna ja rha hai.
target = 128
itne bade time frame ka DZ hai to exit lene ke bahut mauke milenge.

Short Exide IndustriesBroke every levels from where it should reverse. I kind of think it should come to 155/145 levels with an strict sl of 171. Risky trade!!

[POSITIONAL] EXIDEIND LONG BET
risk: Reward ratio is 1: 2
Rest as per Charts
********
Note -
One of the best forms of Price Action is to not try to predict at all. Instead of that, ACT on the price. So, this chart tells “where” to act in “what direction. Unless it triggers, like, let’s say the candle doesn’t break the level which says “Buy/Sell if it breaks”, You should not buy/sell at all.
=======
I use shorthands for my trades.
“Positional” - means You can carry these positions and I do not see sharp volatility ahead.
“Intraday” -means You must close this position at any cost by the end of the day.
=======
Always follow a stop loss.
In the case of Intraday trades, it is mostly the “Low/High of the Candle”.
In the case of Positional trades, it is mostly the previous swings
********

EXIDE IND 1hr analysisEXIDE has been correcting for quiet a bit
now it is at it's support level, it can bounce back from here
if it bounces, the first target can be 180
and it's been following a trendline,
it can also be a target if it breaks the resistance.


exide industriesPOOR exide is struggling so far, 171 level is important to claim, otehrwise 155 152 level we can see, here multiple pattern are present

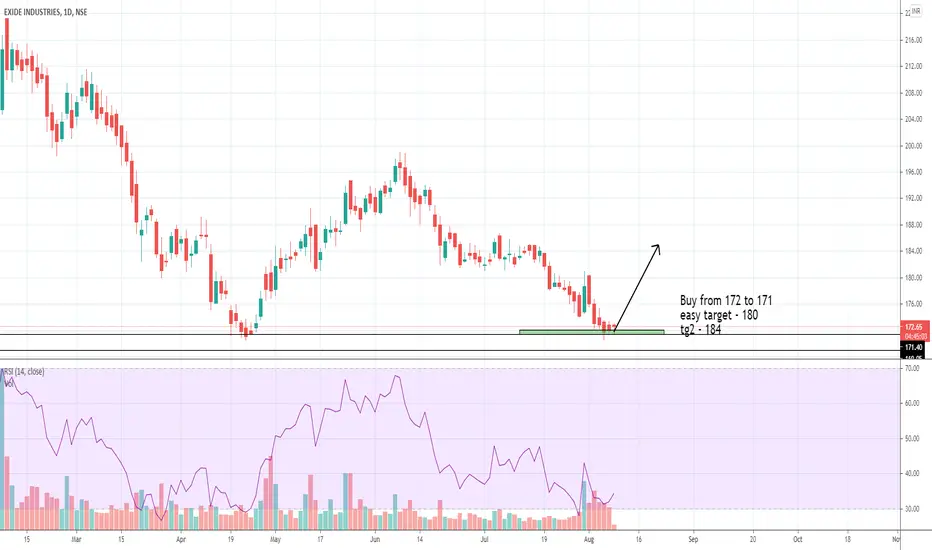
Expected an upward move from CMPExpected an uptrend after a deep correction from 219. If it doesn't break its support of 170.4 can expect an upside with targets up to 196.
This is my first analysis, comment if it's right?

Exide - ready to flyBuy from cmp to 171
easy target - 180
tg2 - 184
Disclaimer : This is my personal analysis for study purpose not intended for trading