EXIDEIND: Buy @ 271.8 SL @ 265.7 TGT @ 281.45EXIDEIND has traded with more then twice the average quantity on NSE with change in OI close to 18%
This is currently trading above ichimoku with price crossing upper Bullinger band.
Signifies a BUY at 271.8 with Stop-loss of 265.7 and Target of 281.45
EXIDEIND trade ideas

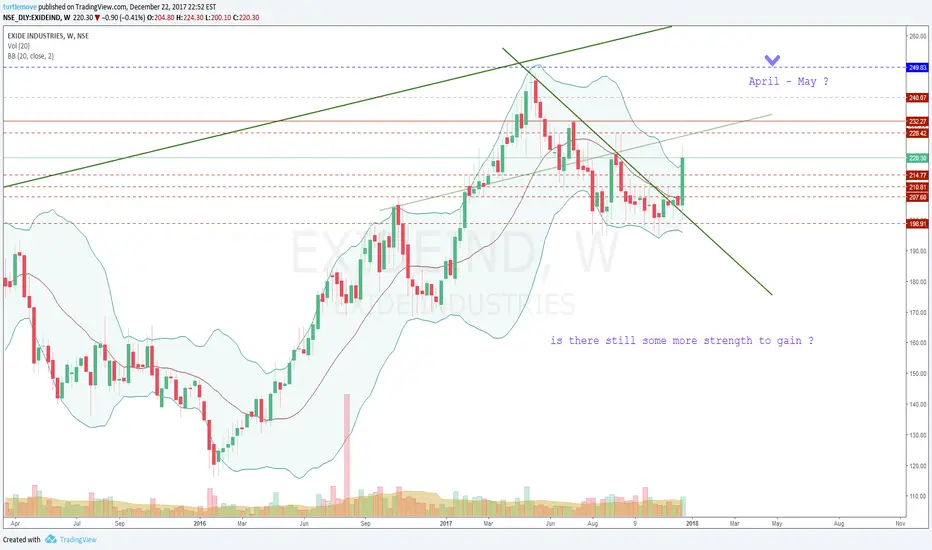
EXIDE getting ready for next swing?Retested 245 again and there is buying pressure. The market has been sideways for quite some time and open interest suggest there is a negative bias. If price goes up and then retraces to 253 (cloud periphery) it could be good entry point with stop at 245.


ShortTerm Buy - NSE:ExideIndExideInd is in short-term uptrend, can be bought above 262 for a target of 300-320 in 5-10 trading sessions. SL is around 239.
Note: These calls are based on my own analysis. It may or may not work well for you. So please carefully consider whether it is suitable for you and please do your own research before attempting any. The profit/loss made by you due to this call, is solely your own responsibility. Thanks, All the best. Happy Trading. :-)

Long Exideind -Intraday.in daily chart, downtrend arrested, bounced above 25ema (support).
long EXIDEIND..
trigger price: 258
Target : 260/262.
Stoploss: 256.

Exide uptrend with a slight change in direction
I am very new to technical analysis so I'm using this wonderful platform to learn, practice and hopefully apply some strategies to make good trades. This is my first analysis.
Exide has been on an uptrend for a while. It made a downward change in direction but it's still in a good zone and looks like it should go up in the near future. Good time to buy and then sell when it starts touching 280.


Sell in Futures Sell Futures on brake of structure , as its moving in agony , any brake of the previous day low with volume is confirmed short selling for Target as forecast

Sell Exideind 1st target 226 and 2nd target 214 Stop loss of 247Sell Exideind 1st target 226 and 2nd target 214 Stop loss of 247

ExideIND - BreakoutNSE:EXIDEIND has broken above its resistance with good volume
Go Long above
T1 - 236.20
T2 - 248.80
SL - 213.60

#Best Wolfe Wave Strategy #Best Wolfe Wave Strategy – Alpha Wolf Trading
The best wolfe wave strategy is a trading strategy with high a profit loss ratio above 90% and it’s based on wolfe waves. The wolf waves have been introduced by veteran trader and market wizard Linda Raschke.
The wolf wave is a naturally occurring trading pattern that can develop across all financial instruments. This chart pattern is made of five alternating waves the same as the Elliott Waves and supposedly it highlights the supply and demand imbalances in the market and possible equilibrium price points.

EXIDEIND shows strengthThere is support at 202, the market fails to break down and surges forward. Took a long position with stop at 212. Initial target is 230 shown in the red box.

self study : Exide short at 215strong resistance around 215....
will see how it goes
enter at 215.....target 205

Exide Tripple Bottom Hour ChartPlease check chart for details...
NB:For educational purpose only. Kindly consult your financial adviser before taking any trading decisions

EXIDEIND Tingling near previous gap down area can trigger a sellEXIDEIND hourly is showing a failure to close the 217-220 gap create earlier. Lingering near the gap and failing to cross above can create a panic for bulls here. Micro structure shows a inter trendline break showing a chance of sell-off here.
EnTry: Cmp 211 or retest of 215 SL
SL: 223 (closing basis on hourly timeframe)
Target: 203/192 and rest ride the trend

Exide Industries: At make or break zoneExide Industries
CMP 201
The zone of 196-205 is a crucial zone for Exide Industries....
The chart reflects and highlights the fact that This has been the zone where Major Buy / Sell decisions have been made so far...
It acted as a resistance in early 2015 and then again in 2016...
The zone has provided support for 4-5 months on a trot in late 2017...
Can it hold once again...???
Are the Bulls strong enough to withstand the onslaught...???
Or will the bears have their say this time around...
Do not rush to enter a trade. Keep calm and Wait for the opportune moment...
Levels have been mentioned in the chart.
Take care & safe trading...!!!

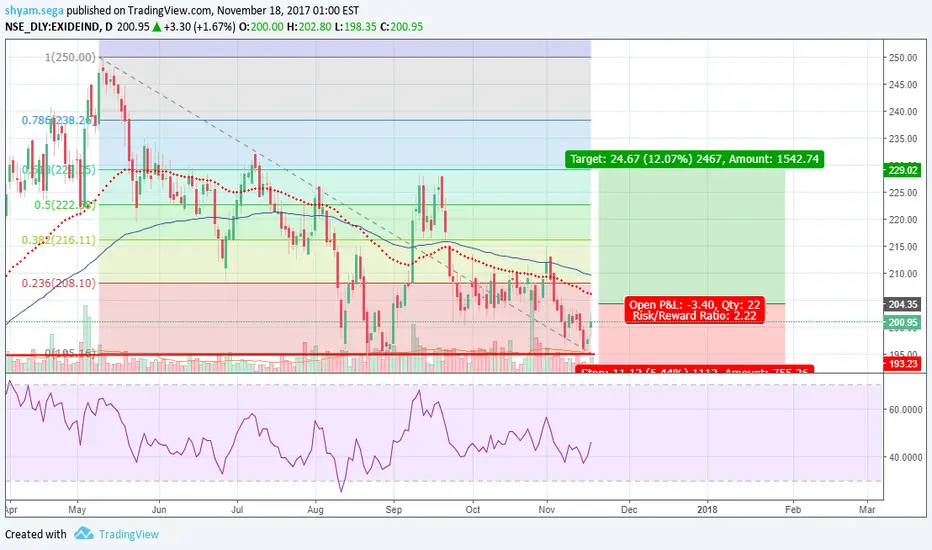
Exide industries - Will it reverse?NSE:EXIDEIND has reversed from its 10 months support.
Go long above 204.45
T1 216.10
T2 229.10
SL 193.20
Exide- clear sell signal- 3 crows
- MACD signal is below
- RSI - started downward
-slow stoc doownward
minimum downward 6-8 Rs
