EXIDEIND trade ideas

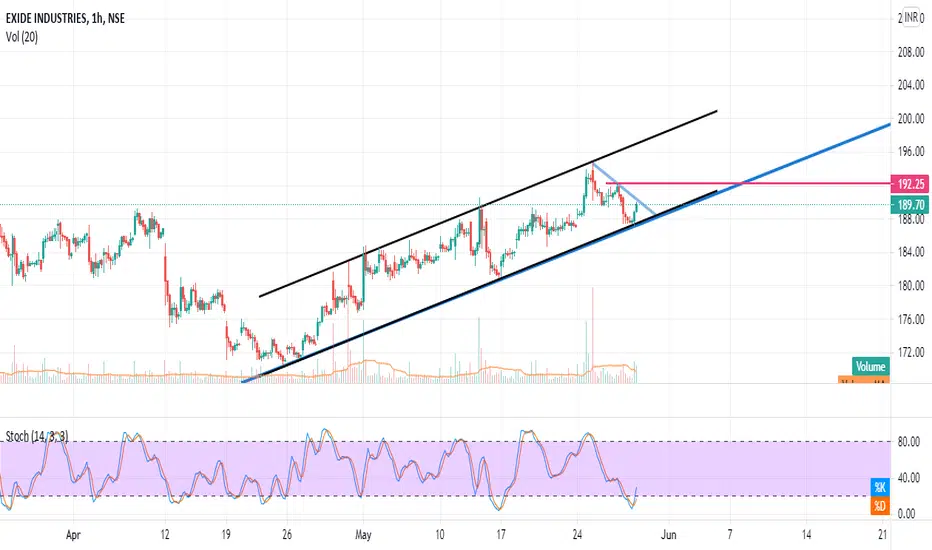
ExideInd - Falling Wedge - BreakoutPrice formed a complete falling wedge pattern and it is getting ready to break. In the lower time frame in the last session a triangle pattern was formed and we can take this as an indication for breakout.

Exide AnalysisNSE:EXIDEIND
Exide currently taking support at uptrendchannel.
Good volume buying near the support and stochastic in 1hr chart is in oversold level.
Can be considered for positional buy for few days
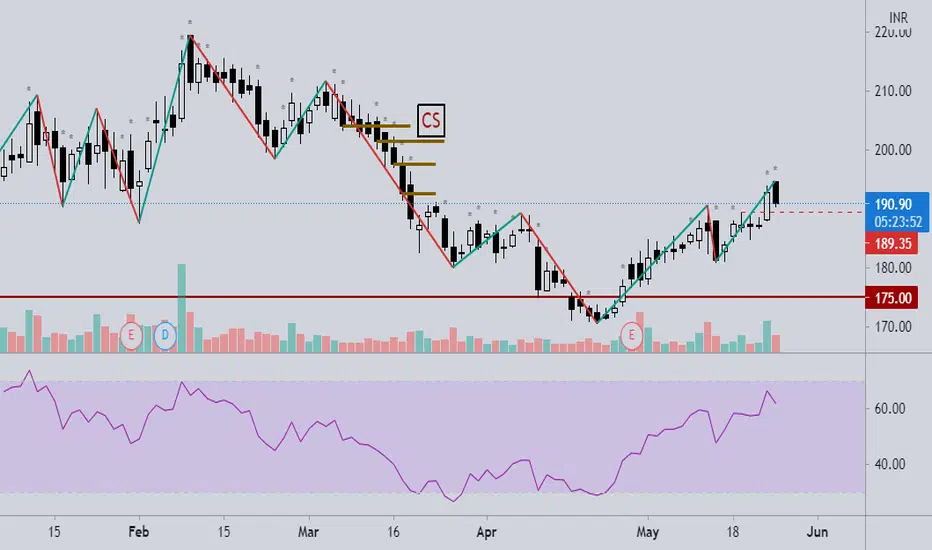
Head and shoulderTarget 208
Stop loss 170
In weekly chart.
Good prospective for future electric vehicle concept.
Risk: Dumping from china is creating heavy competition.
Debt free company
PE:20
Life time PE average 23.
No pledged share

H&S Pattern in ExideExide has given breakout in Head & Shoulder pattern in 1 day timeframe and its looking to give a good move from these levels.
Target can be at 198(T1) - 210+(T2) levels with Sl at 180 with a holding period of 2-3 months. Can also hold this for long term growth.
~ The stock has given decent q4 results.
~ The stock has huge potential in the future having about 60% of market share in ion batteries.
~ The company’s life insurance business is also been seeing growth in the recent times.
*This is just my view enter trade based on your analysis*


EXIDE INDS.. Buy Inverse head and shoulder pattern Buy buy Short term With initial Targets of ( T1 - 200 , T2 - 208 , T3 - 215 ) with stop loss - 180.
Inverse head and shoulder pattern with good volume with good volume

Long term speculation exide Chart is in a inverse head and shoulders pattern With a breakout if it sustains above the horizontal level we can see further upside
Only for educational purposes and not recommended for a trade.

Resistance Breakout in EXIDEIND,Head n shoulder breakout in daily TF,
Auto sector index also good breakout
E= 193.5
S= 180
T= 218
R:R= 1:2

Swing Opportunity in Exide InsustriesGo Long above 194 for a Target of 210 with SL 181
Reasons to go Long :
1. The stock formed a bullish chart pattern 'Inverse Head & Shoulder', and today it closed above the neckline.
2. Also it broke neckline with heavy volumes.

Exide looks bullish#positional
Exide ind former inverted head and shoulder pattern and broken it with a huge volume, giving strength for upside. Keep this in watchlist and trade as per the charts

EXIDE INDUSTRIESExide Industries looks good for long as the trend of the same is uptrend and also respecting the trendline so it can be bought at cmp 183.50 for the targets 191 / 201 / 211 plus with a strict sl of 169 for a short to medium term
All charts posted here are only for EDUCATIONAL PURPOSE.
Before making any Trading Position kindly consult your Financial Advisor.

Exide industries to take long longExide industries at the BO level . Long after the Bo of TL above 193 TGT 212 SL 186. Good volume seen today. This is for your educational purpose only.

Exide IndustriesDisclaimer : Only for educational Purpose,not a stock recommendation
Trading is an art, learn the art!!!
#stockInvestment

Exide IndustriesBroke a Major supply Level With Huge Volume
Entry:- 195
SL:- 183
TP1:- 205
TP2:- 215
Keep Buying At Dips.


EXIDEINDEXIDEIND daily H&S BO...
Weekly chart also looks bullish..
May complete his pattern on weekly TF...


Exide Ind. - CMP: 193The Stock has given Head -N- Shoulder breakout. All oscillators are in positive bios. We can expect price movement till 215 in the near term.

