
EXIDEIND trade ideas


Exide prepared for long tradeExide prepared for long targets T1-187, T2-194, T3- 200.......As per fibbonacci retracement it tested 0.23 level two to three times now ready for 0.38 levels....This is for learning purpose, please consult your financial advisor before taking any trade.

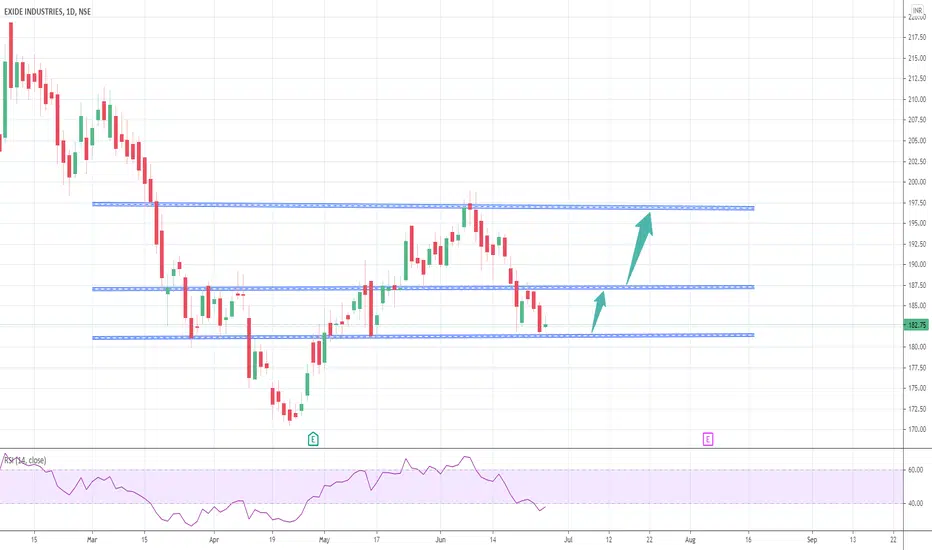
EXIDEIND - BULLISH Sign with good risk to reward ratio (1:5)Buy : 182.75
Target :192
Stoploss : 180.50
#EXIDEIND

going bullish as all moving averages is all togetheralways gives good momemtum when all moving averages comes along either long or short trade as per your views
thankyou-


EXIDE upper parabola pattern reverse cup and handle patternEXIDE upper parabola pattern reverse cup and handle pattern


Buying suggested aroun 170 if it sustains that support Buying suggested at supports if sustains. Green zone on that suggest that area where support is expected . Buying only if it sustains that level.


Exide CMP 183 should Target 190 /200 againExide Industries is a value pick at 183 and has crucial support at 180 levels, Exide should reach 190 + levels very soon. i had previously also recommended this stock at same levels. i giving the link of the post below for your reference.
Exide Industries Ltd | CHART#11Exide Industries Ltd. engages in the manufacture of storage batteries. It operates through the Storage Batteries and Allied Products segment.
* Stock Analysis *
-- Short-term trend of the stock is positive where it is trading above its 20-day SMA
-- Huge scope for Storage Batteries due to adoption of Electric Vehicle in the near future. Best time to invest!
-- Third attempt of Breakout at 175 level (Supply Zone) with good volume
* Important Levels to Watch *
-- Entry @ CMP or after breakout
-- Target @ 200
-- SL 164
Good Luck Investors❗
-GokulHari

Exide in short term down trend Exide in short term down trend
Can go short around CMP 181 with SL at 188
Overall view is that this stock trading within a triangle as per chart. Major Support is at 170 and major resistance at 195.
Do your own analysis before investing.

Exide Industries, Reversal on the way - Inverted Head & ShoulderExide Industries is shown to be forming inverted head and shoulder pattern on a daily/weekly basis. Lately the stock can been trading with higher average volumes in the past few months.
The stock can show a good upside move in the coming days with an initial target of 220 and have the potential to go further up to levels of 300 in medium term supported by strong company fundamentals.


Exide go long for 220Daily chart - Inverted H&S. Trend reversed. Break out and retest done. Consolidation at 190-194. Short term target would be 210-220. SL 180 DCB

EXIDEIND SHORT :(DATE: 17/06/2021.
EXIDE INDUSTRIES BREAKS TRIANGULAR PATTER IN 1 HOUR CHAT AND AT RESISTANCE IN 1D CHART .
SO ITS FOR GO SHORT.
BOTH 1HOUR AND1D CHARTS SHOWS BEARISH MOMENTUM

Exide Industries TrendlineExide industries is following a short term trend line. Indicators are positive.
Stock Reversed from the support of 177.
Bullish move can be seen in coming days.
Be cautious of the trend line break in opposite direction.
First Target will be 210.

EXIDE INDUSTRIES | H&S pattern | EMA + support + trendline conflCMP- 192.80
SL-
Target- 210, 215
25/5/21
- Major EMA support (50/100/200)
- INHS spotted (supportive VOL)
- Trendline break
- Good VOL

Exide - ABCD Pattern - Long IdeaLong Idea - Target 198.
Setup - ABCD pattern
Entry - 185-186
Stop - 169.5
Price Target - 198 range
This is not a high momentum stock and is investment grade.
Even if the stoploss is hit and prices crash, the stock is a great buy around 120 levels.
Disclaimer: Please trade and invest at your own risk.

Trading the Head & Shoulders - Normal and InvertedThis Exide Industries Chart is a perfect example of a Head & Shoulders pattern moving into an Inverted Head & Shoulders pattern.
In the H&S pattern, the neckline forms a crucial support level, whereas in an Inverted H&S, the Neckline forms crucial resistance.
In this particular pattern, volumes have increased during formation of the Head & Right Shoulder in the Inverted H&S, thereby giving an opportunity to buy if the resistance level is broken out of.
