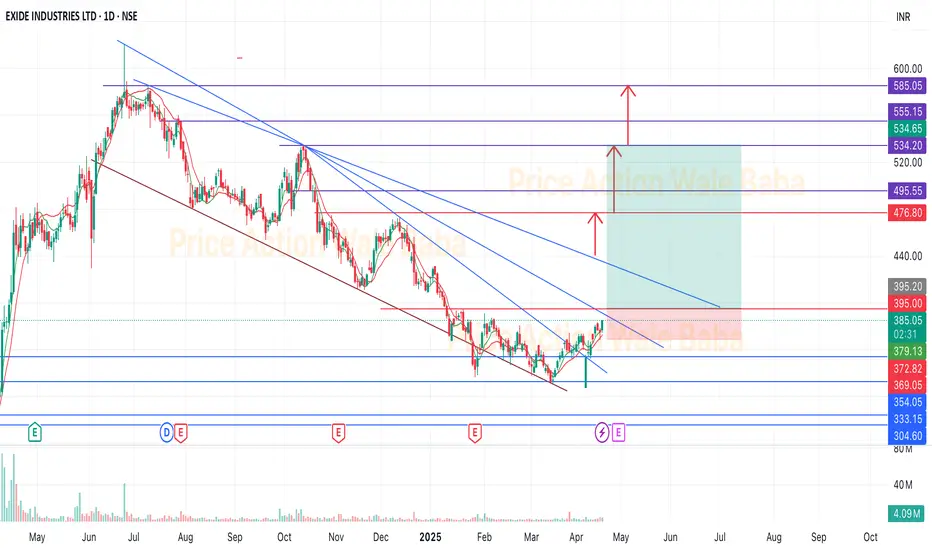
ExideExide near the breakout and looks. good for the up side.
This is bottom out stock and ready to go up.
It's time to buy and hold for the next 6-12 months to take ATH target.
EXIDEIND trade ideas
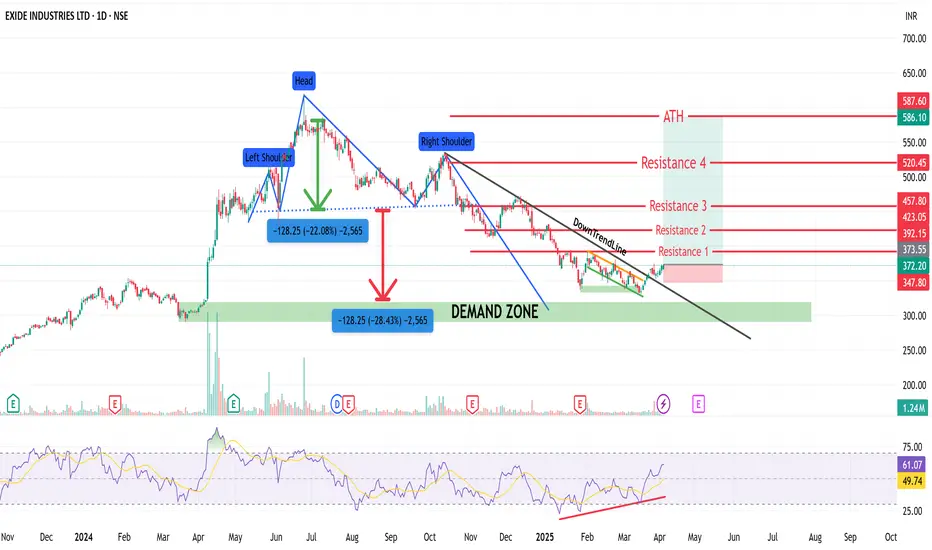
From Wrecked to Rocket: Exide’s Escape from the Demand Dungeon Exide Industries - Technical Analysis Overview
The chart shows a classic Head and Shoulders pattern, confirming a bearish reversal that played out with a 22–28% fall.
Price eventually entered a strong Demand Zone (₹310–₹335), where buying interest emerged, halting the downtrend.
A Falling Wedge breakout has occurred — a powerful bullish reversal signal — supported by increasing volume, indicating accumulation.
At the bottom, Bullish RSI Divergence is clearly visible — RSI formed higher lows while price made lower lows, signaling momentum shift.
The RSI has now crossed 61 , indicating growing bullish strength.
Price has reclaimed key levels and is now approaching multiple resistance zones:
R1: ₹373.55
R2: ₹392.15
R3: ₹423.05 / ₹457.80
R4: ₹520.45
ATH: ₹586.10 / ₹587.60
📊 Inference:
The stock has respected structure perfectly — from pattern breakdown, bounce at demand, and now wedge breakout.
Sustaining above ₹373.55 could trigger further rallies toward ₹392–423 and eventually ₹457–520 if momentum holds.
Long-term breakout above ₹587 would signal fresh highs and trend continuation.
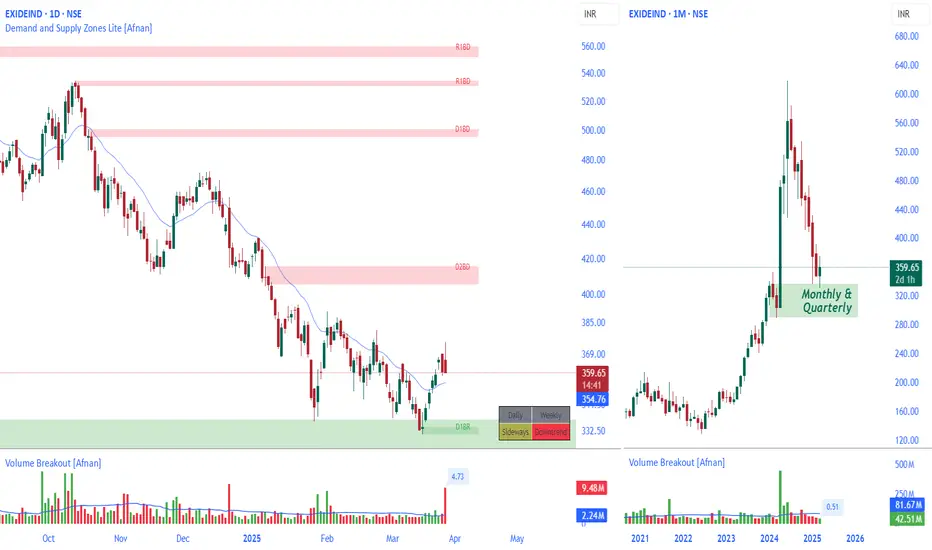
EXIDEIND: A Potential Reversal from Institutional Demand Zone?EXIDEIND has been in a downtrend since June 2024. However, an interesting development has occurred—price has reached a crucial monthly & quarterly demand zone , which is often a footprint of institutional activity. When price enters such zones, it indicates that big players (institutions, banks, and hedge funds) might be accumulating positions.
As a result, the downtrend has stalled , and the stock has moved into a sideways consolidation . This shift suggests that institutional buyers may have stepped in, absorbing the selling pressure and preventing further decline.
📊 Key Observations
EXIDEIND has taken support from both the monthly and quarterly demand zones , strengthening the case for a potential upward move.
The trend is still sideways on the daily timeframe , indicating a phase of accumulation or consolidation before the next big move.
If the price sustains above this demand zone, we may expect an upward move in the coming sessions .
💡 "The market rewards patience and discipline. Stick to your plan and let the charts guide your way!"
This analysis is for educational purposes only and is not intended as a trading or investment recommendation. I am not a SEBI registered analyst.
Pattern repeating Example the Professional way to identify and check the pattern repeating it self
In this video i made efforts in Explaining the way i look the chart
if you have experienced the same thing in the past please comment below
if you have Questions about this method comment below i will try to address it
thanks

EXIDE: Must be on RadarWait for the price to tap in the demand zone and then we plan for a entry for now, just keep on eye on it.
⚠️ Disclaimer: This is NOT a buy/sell recommendation. This post is meant for learning purposes only. Views are personal. Please, do your due diligence before investing.⚠️
💬 Drop your thoughts below in the comments section if you liked this analysis!✌️
🔥Happy trading!✅🚀

EXIDEIND - opportunity for quick 5% gainsNSE:EXIDEIND
cmp 364
there is an opportunity for getting quick 5% gains in this stock.
on hourly timeframe there is trendline breakout plus positive diversion on the RSI
I will be looking for entry at cmp 364 with target of 382-385
SL will be 353.
The objective of this analysis is knowledge sharing and education. There isn't any buy or sell advise in this article.
It is expected of each person to carry out own research and evaluation to ascertain whether my perspective is matchingwith your studies.

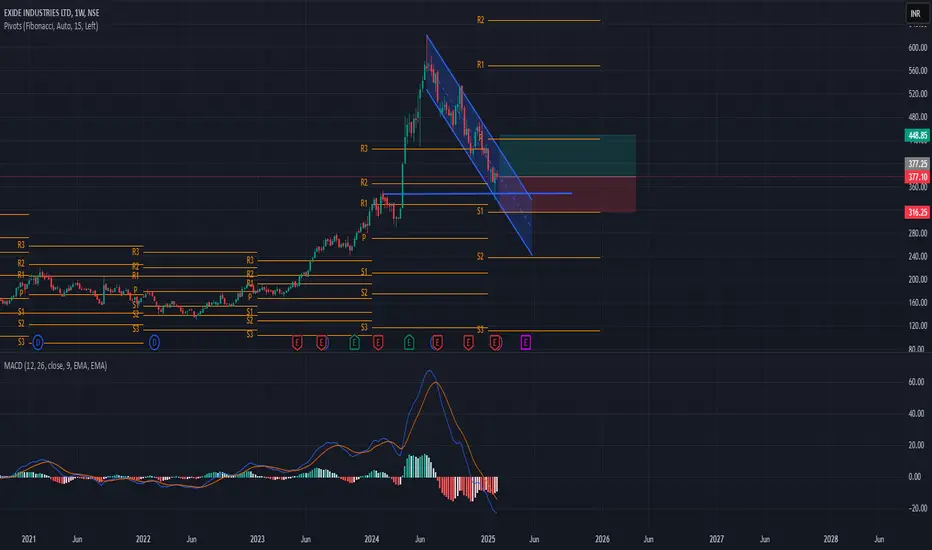
Exide Industries Technical Analysis: Will the Downtrend Reverse?Chart Analysis and Observations
Descending Channel Pattern:
The price is trending downward within a clearly defined descending channel.
The lower highs and lower lows indicate sustained bearish momentum, with immediate resistance forming along the upper boundary of the channel.
Support and Resistance Levels (Pivot Points):
Immediate Support: ₹348 (S1 level, acting as a crucial defense zone).3
Major Support: ₹316 (S2 level and psychological support).
Immediate Resistance: ₹448 (R1 level and Fibonacci resistance).
Major Resistance: ₹488 (top of the descending channel).
MACD Analysis:
The MACD is in negative territory, with the MACD line below the signal line, confirming bearish momentum.
However, the histogram shows signs of reducing bearish pressure, indicating a potential trend reversal or consolidation phase.
Fibonacci Levels:
Fibonacci pivot levels align well with the major support and resistance zones, giving traders additional confidence in entry and exit points.
The stock is hovering near ₹377, close to the S1 level, where a bounce might occur.
Potential Trading Setups
Bullish Reversal Scenario:
If the stock manages to break out of the descending channel and close above ₹448, it could target the ₹488 level in the short term.
Entry Point: ₹380–₹390 (after confirming a bounce).
Stop-Loss: ₹348.
Target 1: ₹448.
Target 2: ₹488.
Risk-Reward Ratio: Favorable if volume supports the breakout.
Bearish Continuation Scenario:
A breakdown below ₹348 would signal further downside, with the next target at ₹316.
Entry Point: ₹345–₹350 (after confirming breakdown).
Stop-Loss: ₹370.
Target 1: ₹316.
Risk-Reward Ratio: Moderate, given the proximity to strong support.
Key Takeaways
Short-Term Outlook:
The stock remains in a bearish zone unless it breaks out of the descending channel. The ₹348 level is critical, and a break below it could trigger further downside.
Long-Term Outlook:
The overall trend for Exide Industries remains weak, but signs of decreasing bearish momentum suggest that a reversal might be on the horizon.
Trading Strategy:
Range-bound strategies can work well while the stock remains in the channel.
Wait for a breakout or breakdown for directional moves.
Conclusion
Exide Industries is at a pivotal juncture, with critical levels to watch at ₹348 and ₹448. Traders should closely monitor price action and volume for signs of a breakout or breakdown. While the bearish trend dominates, reduced momentum indicates potential reversal opportunities for long-term investors. Use proper risk management to navigate the current volatility effectively.
High conviction / value buy stock pick - EXIDEINDCheck this stock which has made an all time low and high chances that it makes a "V" shaped recovery.
> Taking support at last years support or breakout level
> High chances that it reverses from this point.
> Volume dried up badly in last few months / days.
> Very high suspicion based analysis and not based on chart patterns / candle patterns deeply.
> VALUABLE STOCK AVAILABLE AT A DISCOUNTED PRICE
> OPPURTUNITY TO ACCUMULATE ADEQUATE QUANTITY
> MARKET AFTER A CORRECTION / PANIC FALL TO MAKE GOOD INVESTMENT
DISCLAIMER : This is just for educational purpose. This type of analysis is equivalent to catching a falling knife. If you are a warrior, you throw all the knives back else you will be sorrow if it hits SL. Make sure to do your analysis well. This type of analysis only suits high risks investor and whose is willing to throw all the knives above irrespective of any sectoral rotation. BE VERY CAUTIOUS AS IT IS EXTREME BOTTOM FISHING.
HOWEVER, THIS IS HOW MULTIBAGGERS ARE CAUGHT !
STOCK IS AT RIGHT PE / RIGHT EVALUATION / MORE ROAD TO GROW / CORRECTED IV / EXCELLENT BOOKS / USING MARKET CRASH AS AN OPPURTUNITY / EPS AT SKY.
Time makes money, GREEDY & EGO will not make money.
The real deal is when to purchase and where to purchase the stock.
LET'S PUMP IN SOME MONEY AND REVOLUTIONIZE THE NATION'S ECONOMY!

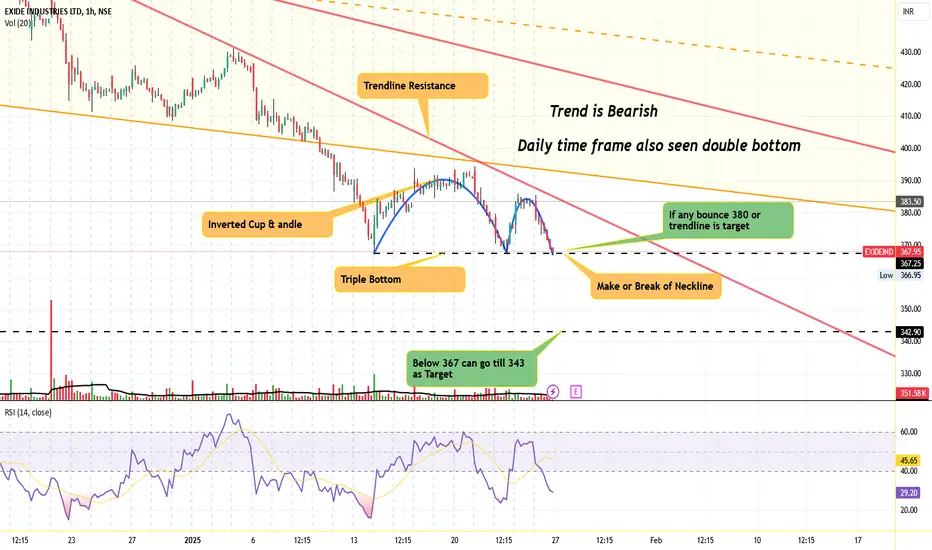
ExideindAs we see on Hourly chart it has formed triple bottom and double bottom on daily time frame and overall stock is in downward channel and indicates a bearish trend, as of now it's like make or break scenario any further decline can lead to another 3-7% downside as per inverted cup and handle structure pattern. if any bounce from neck line and crosses above high of cup we may see a failure of structure pattern. Just a view not a Reco...
Double Bottom-Exide IndustriesDouble Bottom &
No Sellers below the mark level
Exide Industries Ltd is primarily engaged in the
manufacturing of storage batteries and allied products in India.

Exide industry_Auto-sector are bullishMade beauty double bottom, in downtrend, made W pattern, NSE:EXIDEIND

Exide Industries Seems to be well consolidatedExide has been in downtrend for past 3 months,from October 24.It has just shown a small break out after 3 months of fall.RSI is showing positive divergence,I feel the stock may touch Rs 516 /548 level as per fibonocci retracement.
Critical Break out at Rs 445
Time Frame 45-60 days
We can buy with a very small SL-Rs 408

20th december exide intradayexide has shown a breakout on 15 minutes ,however daily breakout will be above 466
today exide is having a good news due to its pact with hyundai
so , buy in zone 445-448
with stop loss of 440
target would be 456-460-465
466 ke upar it will be rocket

Exide Short | 19 Dec | IntradayExide is weak in hourly timeframe
As Explained in chart once price get rejected from supply zone or Break swing low. We will look for 440 as target.
Explained in chart as well with levels.

EXIDEIND#EXIDEIND appears poised to reclaim its uptrend after breaking out of the downward channel and a 3-month consolidation. Strict stop-loss recommended as mentioned on the chart.

Exide Inverted HnS plus double bottomA bullish trade on Exide in daily TF
Entry Range- 462-464
Sl- 450
Target- 480, 490
Pattern- Inverted HnS in Daily TF and A double bottom.
Note- Entry to be made on retracement at the given Entry level. Very good Risk Reward Trade.
Disclaimer-This trade is just for educational purpose. Please take advice from your financial advisor before taking any trade.

EXIDED INDUSTRIES (-elliott-wave-theory)We can again see in the stock of a EXIDE industry that the alien wave theory is being formed and here you will see inside the chart that from the price of ₹ 300 to the price of ₹ 400, big players have made activity entry, which is working like an export and here we can see inside the stocks that the N Sled pattern is being formed, we can see where the stocks have made corrections in time along with the price and when such a chart pattern is formed and there is a breakout in it, then we see the stock going up, so here we can get to see very good price projections in the long term and here also we can clearly see the elliott-wave-theoryry being formed, so this can also be a very good example of elliott-wave-theory, you can clearly see it being formed on the chart with time, this is not an investment idea, we are sharing it only for educational purpose that how the technical things work on the chart, but all these things will be possible then When good profits are seen in the balance sheet of the company, the sales of the company increase and the profits increase, then all these things can be seen as possible. The share price does not move only on technical illnesses. The profits of the company should increase, then all these things start appearing in the share price of the company. If you want to invest, take the advice of your financial advisor and invest only after that.

Clear cut indication on Exideind for upside moveAfter long fall exideind stock formed cup and handle pattern. It's a good sign for upside move expected above Handle let's see what's will happen.

Exideind | All Resistance Trendline Breakout ⭕️ Swing Trading opportunity: Price Action Analysis Alert !!!⭕️
💡✍️Technical Reasons to trade or Strategy applied :-
✅Inverted Head & Shoulder Chart Pattern Bull Breakout
✅Breakout confirmed
✅Rise in Volume
✅Good 3 touches Trendline Breakout with volume
✅Clear uptrend with HH & HLs sequence
✅ Order block as potential Target
✅Check out my TradingView profile to see how we analyze charts and execute trades.
🙋♀️🙋♂️If you have any questions about this stock, feel free to reach out to me.
📍📌Thank you for exploring our idea! We hope you found it valuable.
🙏FLLOW for more !
👍LIKE if useful !
✍️COMMENT Below your view !

Exide Double bottom An early bullish entry in Exide.
Pattern- Double bottom ( Note it's an early entry pattern has not completely formed)
Entry- 449 450 levels
SL- 447-448
Target- 455 458
Note- Risky trade.
Disclaimer - This is just for educational purpose please take advice from your financial advisor before making any decision.

EXIDEIND Trading Within Fresh Demand ZoneEXIDEIND is currently trading at ₹418.1, positioned within its demand zone between ₹423.65 and ₹398.85, identified on 16th April 2024. This zone remains fresh and untested, suggesting potential buying interest if the stock price consolidates within this range. Investors may look for signs of support, potentially signaling an upward movement from these levels.

EXIDE INDUSTRIESNSE:EXIDEIND
cmp 440 and support will be 430..invest for long term and do SIP on every 10 percent fall from current level

exideind is bullish now after a good fall , it is very interesting to buy and go long
tareget is - 505
after that its 512
