EXIDEIND trade ideas


Exide Industries - Weekly Exide Industries - Weekly
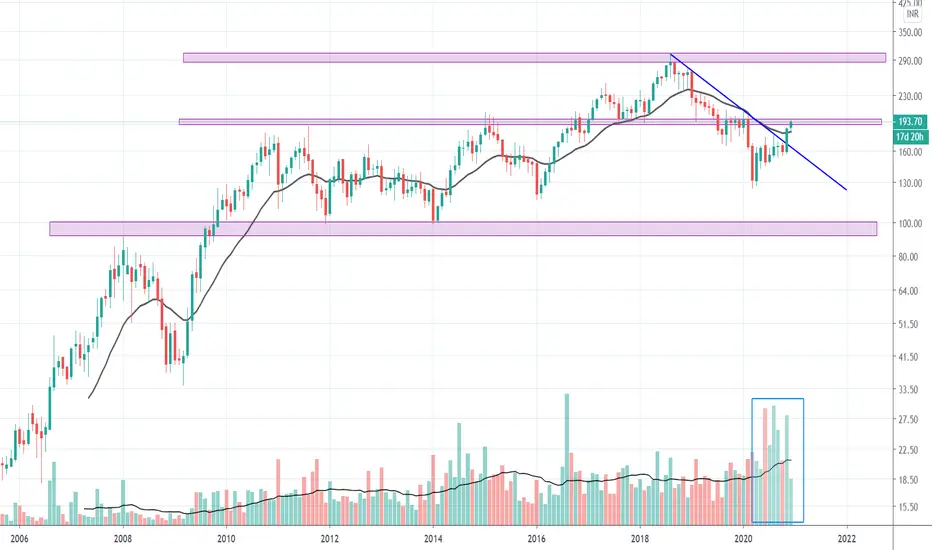
Stock currently trading at multi year resistance, Crossing it will become support
Weekly close and now trading above 200 EMA, huge accumulation clearly shown in volume at 160-170 levels
one can buy only above 198 on closing basis for intermediate targets of 230-240.
Note- Weekly chart should be considered for 3-6months time span


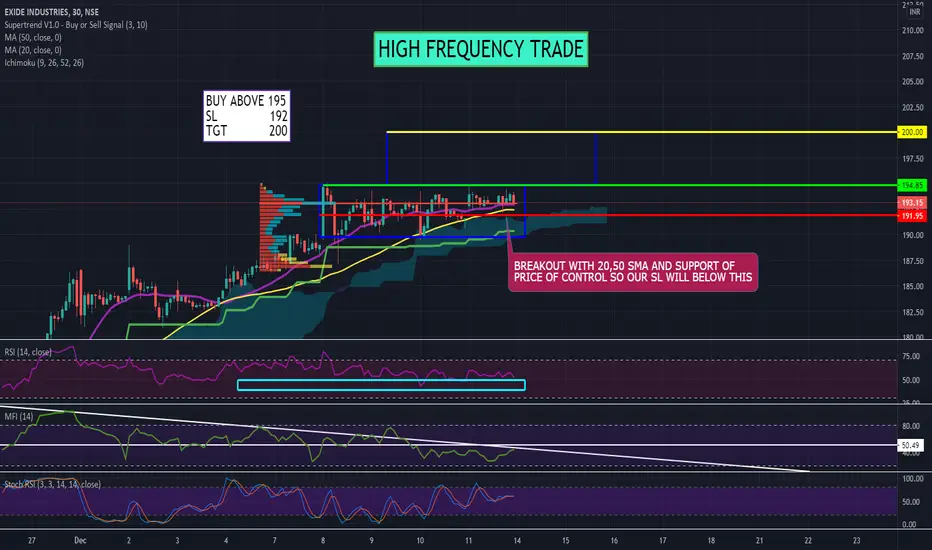
EXIDE LONG TILL 200+BOUGHT AT 190 CMP WITH SL OF 188 ON CLOSING BASIS FOR TARGET OF 200+ .............RISK REWARD RATIO 1:5


EXIDE - BUY SETUP FOR 30 DEC 2020Price 193 holds a strong resistance for Exide , if it breaches it in the opening and sustains then we can expect upper levels.
Look for buying opportunity at buyzone 1.

Exide Industries - Buy on DipsChart is self explanatory.
Note - This is only for educational purpose.

Exide Industries breakoutExide industries i showing signs of a breakout on short term chart.
Keep on radar and take a call after confirmation candle.
Please like and follow.
NSE:EXIDEIND


EXIDEIND is in making for very Big towards 205/265/300Weekly breakout with Good volume ... Very good sign for investment in mid to long term investment... Do the pyramiding, intraday traders utilize the movement in the stock and Safe players can enter the trade on retracement with strict SL.....
Note:
1. Views are personal. Recheck and take the trade as per your RR.
2. Always remember SL is your lifeline not the big target...
3. Learn before executing the trade..
4. To learn more about patterns and trading... contact us.. Thanks..
Like, Share with friends, subscribe for motivating us share charts like this...
Note: Reposting since my earlier post is hidden due to contact info added in wrong area.


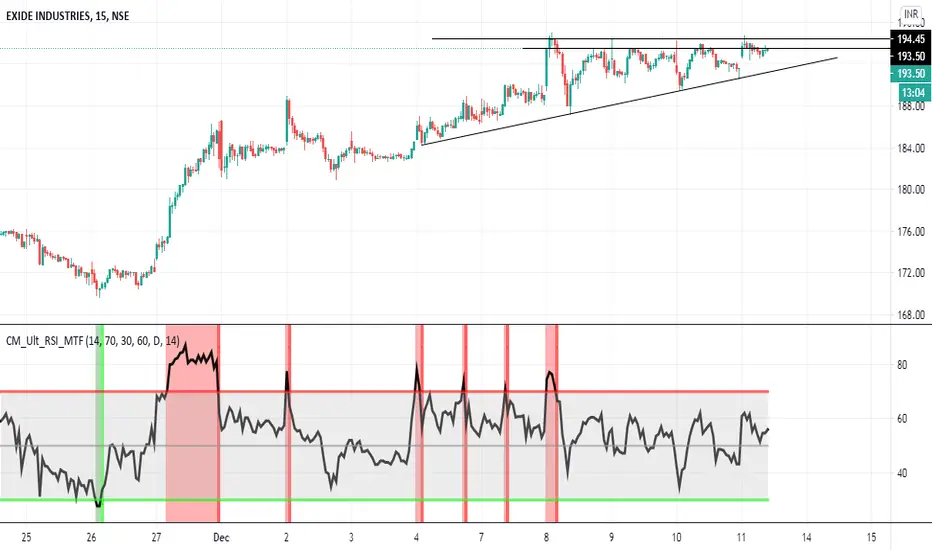
EXIDEIND - AT RESISTANCE (MAY BREAK)An ascending triangle is a clear cut indication of consolidation followed by a breakout. A BIG BREAKOUT...........
Note:
Avoid the stock if a big gap up or gap down is seen
Enter after the breakout happens and not before it
Do not chase the market, i.e., do not get involved in late entries
Only enter with strict stop-loss and target
This is not a recommendation and is for educational purposes only.
always follow risk-reward and quantity management for the 100% of the times
The above mentioned idea may not work, so beware of the risk you are taking
Follow me to Learn and Earn with me.
Happy Trading!!

EXIDEIND Long IdeaEXIDEIND is in clear uptrend making HL and Hitting Resistance level
Above 195 is fresh breakout , view negates below 189 levels