EXIDEIND Setup for Monday 27 July 2020 (Intraday)Analysis Methodology:
1. Trend Line
2. Support/Resistance or Supply/Demand
Caution: Choose by self analysis and confirmation.
EXIDEIND trade ideas

Exide Industries - Intraday Trading Setup for 24 July 2020Disclaimer: All charts are purely for educational and information purpose only. Invest or Trade at your own risk.

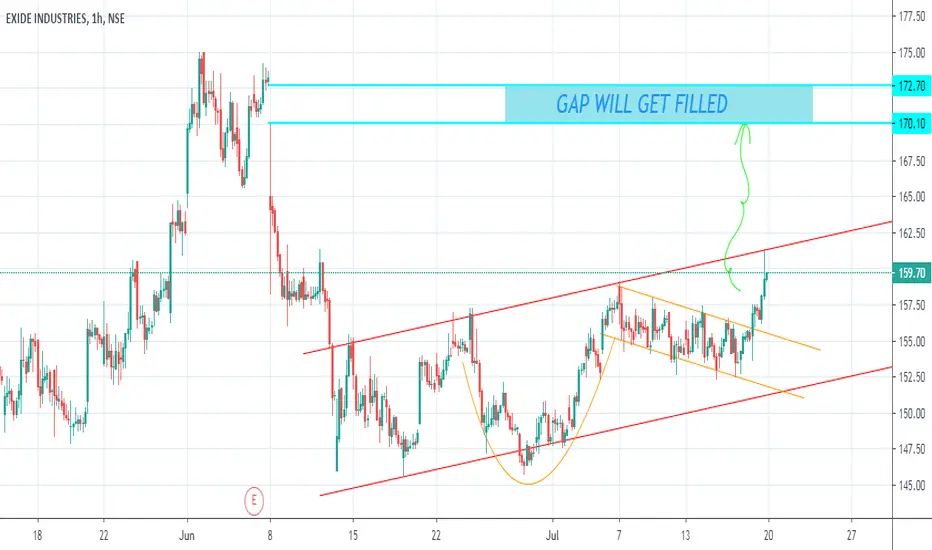
Exideind for 3% targetGo long or short on break of this pattern and close outside the trendline in 1hr for simple 3% target

#EXIDEIND CASH : LOOKS GOOD ABOVE 162.50EXIDEIND CASH
21.07.2020
LOOKS GOOD ABOVE 162.50
STOPLOSS 159
TGT 165.50/168.50/172
CMP 160.65

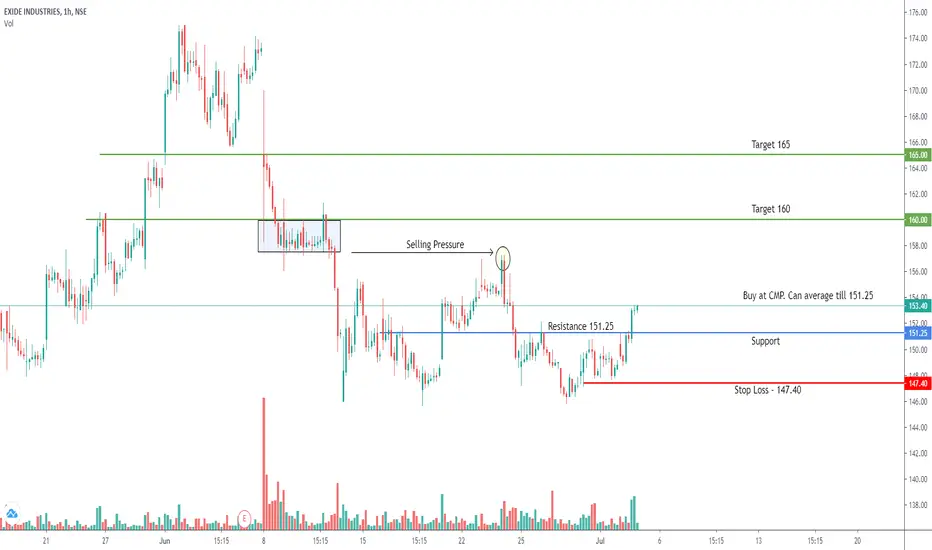
EXIDEIND - Good breakout opportunity with volumeCMP : 153.05 (Wait for Pull back upto 150 to 151)
Target : 163 or trend line resistance whichever is met first
SL : 146
Breakout with good volume
RSI Divergence supporting the breakout


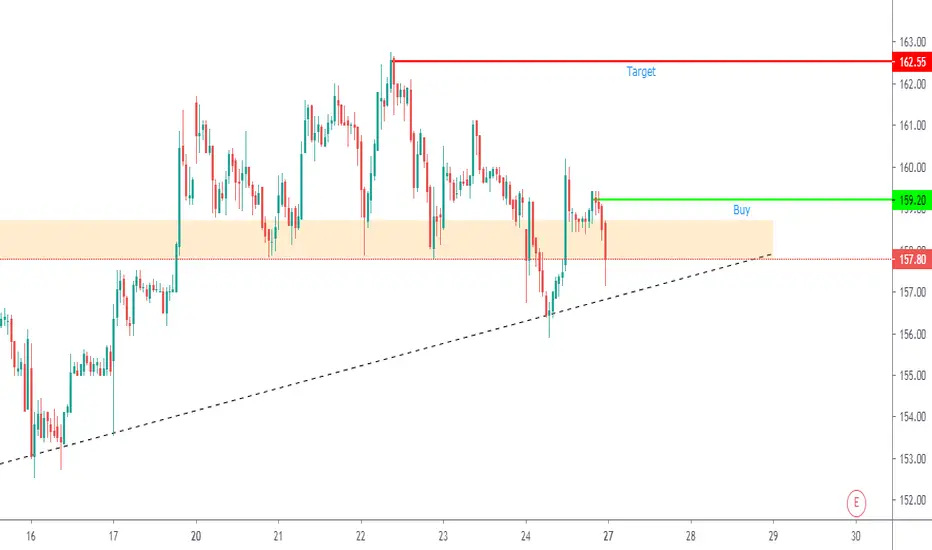
EEXIDEIND-Important LevelsIf taken support then go Long, If Support breaks then short.
Chart is for Educational Purpose only-Trade with your Own Risk

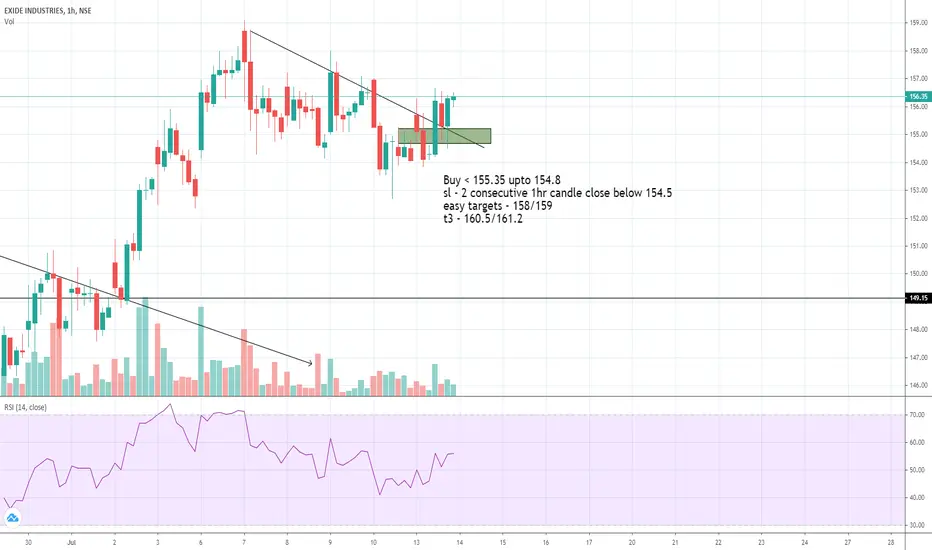
Exide - buy on dipsBuy < 155.35 upto 154.8
sl - 2 consecutive 1hr candle close below 154.5
easy targets - 158/159
t3 - 160.5/161.2
Disclaimer : This is my personal analysis for study purpose not intended for trading
Stock Analysis of Exide IndustriesExide Industries - CMP - ₹156.20 Dt. - 13-07-2020
In the historical daily chart, the price has respected the cross of 21DEMA and 50DEMA and gave a good trend on both sides. On 13-07-2020 the 21DEMA is all set to cross above the 50DEMA and if tomorrow it crosses above 50DEMA with good volume then the stock can give return up to 8-10% in 8-9 trading sessions.
RSI and CCI are neutral, however, MACD has given buy signal. If the stock moves upward then first resistance is placed at ₹160.70 followed by ₹164.45. If stock began to move down then it can go up to ₹145.80.


EXIDE INDUSTRIES Trading SetupDisclaimer: All charts are purely for educational and information purpose only. Invest or Trade at your own risk.


# 15 LONG Exide for 30 - 40 Trading SessionsNSE:EXIDEIND
Reason Being:
1. Formation of Triangle pattern and Upper Breakout with Volume Confirmation
The price breaks above the upper trendline with a noticeable increase in volume, confirming this bullish pattern as a reversal of the prior downtrend.
Every Price Action Pattern after breakout provides some Target Range and according to Triangle:
Target Price: 170 and 185
View Negated Below: 145
#Disclaimer: I'm not a SEBI Registered Research Analyst, These are my views, please consult your Investment Advisor before buying and selling any position. This is just for Education Purpose.


EXIDE INDUSTRIES Trading SetupDisclaimer: All charts are purely for educational and information purpose only. Invest or Trade at your own risk.