Exide Ind EtStockRecoAnand Rathi: Buy target 190
Buy when a bullish reversal bar closing near its high is formed a the trend line. Keep the low of this bar as the SL. Target Trend channel line.
EXIDEIND trade ideas


[Turtle] Exide Results BetIdea 1: 155CE Sell 155PE Sell
Idea 2: 145PE Sell
Idea 3: 150 PE Sell 145PE Buy
Note -
One of the best forms of Price Action is to not try to predict at all. Instead of that, ACT on the price. So, this chart tells at "where" to act on "what direction. Unless it triggers, like, let's say the candle doesn't break the level which says "Buy if it breaks", You should not buy at all.
=======
I use shorthands for my trades.
"Postional" - means You can carry this positions and I do not see sharp volatility ahead. (I tally upcoming events and many small kinds of stuff to my own tiny capacity.)
"Intraday" -means You must close this position at any cost by the end of the day.
"Theta" - means These are weekly options trades. If I don't explicity write the Expiry, I am talking about current week's only.
"Bounce" - A swing Trading Pattern. Google - "unofficed bounce"
"3BB" or "Entropy" - A Bollinger Band Based System which uses Bollinger Band to screen trade and Price Action to Enter. Google - "unofficed entropy".
=======
I won't personally follow any rules. If I "think" (It is never gut feel. It is always some reason.) the trade is wrong, I may take reverse trade. I may carry forward an intraday position. What is meant here - You shouldn't follow me. You should follow the system I share.
=======
Like -
Always follow a stop loss.
In case of Intraday trades, it is mostly the "Day's High".
In case of Positional trades, it is mostly the previous swings.
I do not use Stop Loss most of the time. But I manage my risk with options as I do most of the trades using derivatives. My trades are live in my forums, in comments, on Youtube. You can tail me if you want to do so.
=======
I will keep adding this description and it will be the same or similar in most of the trades I post.

Exide_6% upside profitDate: 18 July 2020
Exide Industries (CMP 159.80)
Double Bottom and Flag pattern can be seen in the chart. Price trading well above 20 DEMA and 50 DEMA.
Target 170. If 170 is achieved then next target will revised at 180.
T1- 163, T2-166, T3-170; SL-155
PCR = 0.41; Max OI at 160 CE (12.31 Lacs), 165 CE (7.02 Lacs) and 170 CE (7.07 Lacs).

Exide - Hidden Divergence + Hanging ManHidden Divergences indicate the uptrend in price should continue.
The price action candle pattern supports the hypothesis.
So unless, its a super Bearish Market tomorrow, it should be a good trade!
Go Long above 154.5 for 156, 157, 160 (if it sustains above 157.3 - 50 DMA) with SL at 153


Exideind short term setupAccording to CPR concept we can see good movement on downside.
Target would be 151/149/148. Invalid above 156

Exide Industries - Intraday Trading Setup for 27 July 2020Disclaimer: All charts are purely for educational and information purpose only. Invest or Trade with the help of your financial advisor.

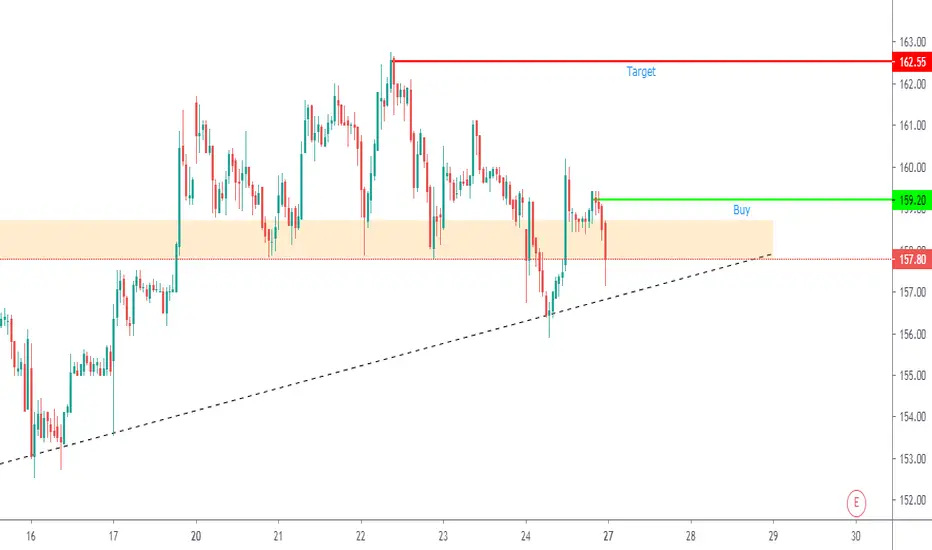
EXIDEIND Setup for Monday 27 July 2020 (Intraday)Analysis Methodology:
1. Trend Line
2. Support/Resistance or Supply/Demand
Caution: Choose by self analysis and confirmation.

Exide Industries - Intraday Trading Setup for 24 July 2020Disclaimer: All charts are purely for educational and information purpose only. Invest or Trade at your own risk.

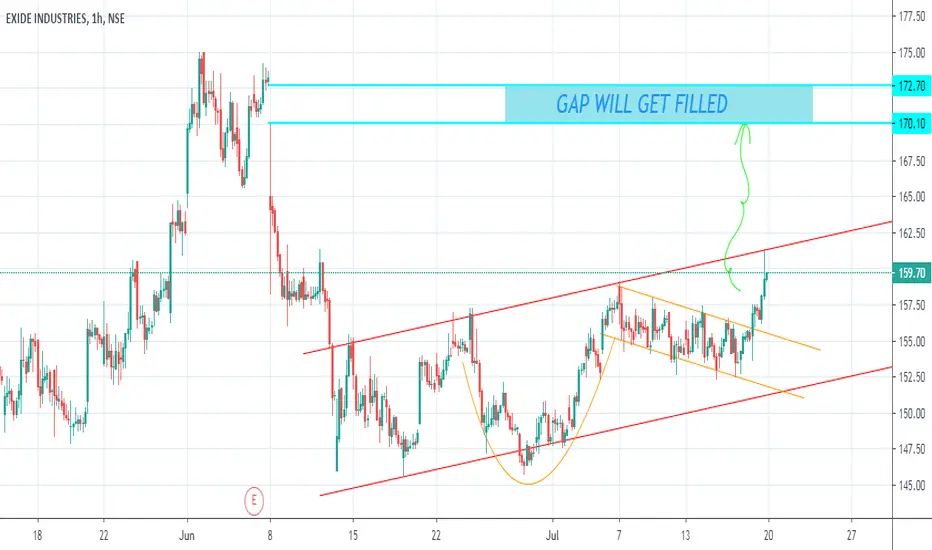
Exideind for 3% targetGo long or short on break of this pattern and close outside the trendline in 1hr for simple 3% target

#EXIDEIND CASH : LOOKS GOOD ABOVE 162.50EXIDEIND CASH
21.07.2020
LOOKS GOOD ABOVE 162.50
STOPLOSS 159
TGT 165.50/168.50/172
CMP 160.65

EXIDEIND - Good breakout opportunity with volumeCMP : 153.05 (Wait for Pull back upto 150 to 151)
Target : 163 or trend line resistance whichever is met first
SL : 146
Breakout with good volume
RSI Divergence supporting the breakout


EEXIDEIND-Important LevelsIf taken support then go Long, If Support breaks then short.
Chart is for Educational Purpose only-Trade with your Own Risk

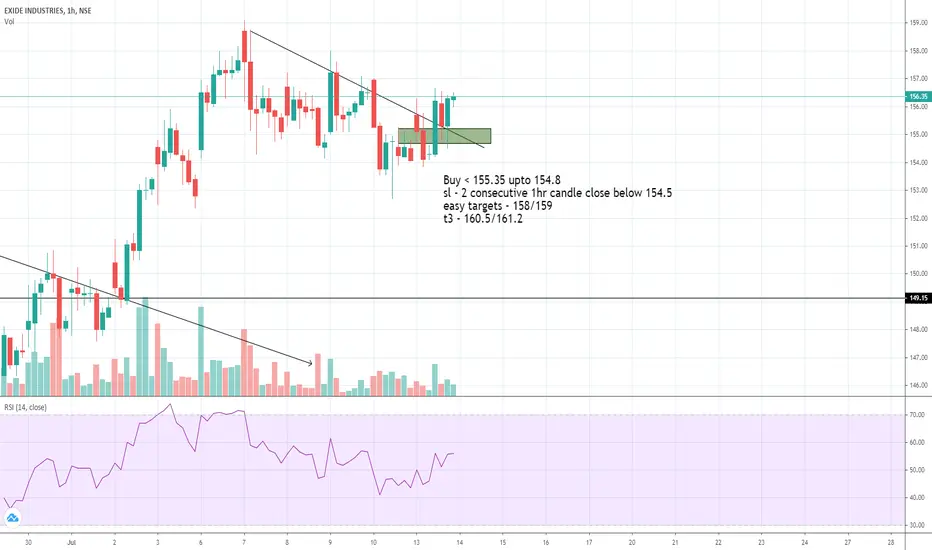
Exide - buy on dipsBuy < 155.35 upto 154.8
sl - 2 consecutive 1hr candle close below 154.5
easy targets - 158/159
t3 - 160.5/161.2
Disclaimer : This is my personal analysis for study purpose not intended for trading
Stock Analysis of Exide IndustriesExide Industries - CMP - ₹156.20 Dt. - 13-07-2020
In the historical daily chart, the price has respected the cross of 21DEMA and 50DEMA and gave a good trend on both sides. On 13-07-2020 the 21DEMA is all set to cross above the 50DEMA and if tomorrow it crosses above 50DEMA with good volume then the stock can give return up to 8-10% in 8-9 trading sessions.
RSI and CCI are neutral, however, MACD has given buy signal. If the stock moves upward then first resistance is placed at ₹160.70 followed by ₹164.45. If stock began to move down then it can go up to ₹145.80.


EXIDE INDUSTRIES Trading SetupDisclaimer: All charts are purely for educational and information purpose only. Invest or Trade at your own risk.
