Institutional Option Trading Part -4Common Institutional Option Strategies
Covered Call Writing: Selling call options against stock holdings to generate income.
Protective Puts: Buying puts to insure portfolios against downside risk.
Spreads (Vertical, Horizontal, Diagonal): Limiting risk while aiming for a defined profit range.
Straddles and Strangles: Betting on volatility, regardless of market direction.
Iron Condors: Selling out-of-the-money calls and puts to profit from low volatility.
Tools and Platforms
Order Management Systems (OMS): To handle complex orders efficiently.
Execution Management Systems (EMS): For rapid and algorithmic order execution.
Advanced Analytical Software: For options pricing, risk assessment, and scenario analysis.
Advantages of Institutional Option Trading
Ability to execute large trades without significant slippage.
Access to lower fees due to trade volume.
Enhanced risk management capabilities.
FINNIFTY1! trade ideas

Learn Institutional Trading Part-2What is Investing?
Investing involves committing your money to various assets like stocks, mutual funds, gold, real estate, or bonds to grow your wealth over time. Investing is generally a long-term strategy, focusing on the gradual accumulation of wealth.
Key Types of Investments
Stock Market Investments: Buying shares of companies.
Mutual Funds: Pooling money with other investors.
Bonds: Lending money to companies or governments for interest.
Gold & Real Estate: Physical assets that typically grow over time.
Investment Strategies
Value Investing: Buying undervalued stocks.
Growth Investing: Investing in companies with high growth potential.
Dividend Investing: Investing in companies that pay regular dividends.
Benefits of Investing
Builds wealth over time.
Helps fight inflation.
Provides financial security.

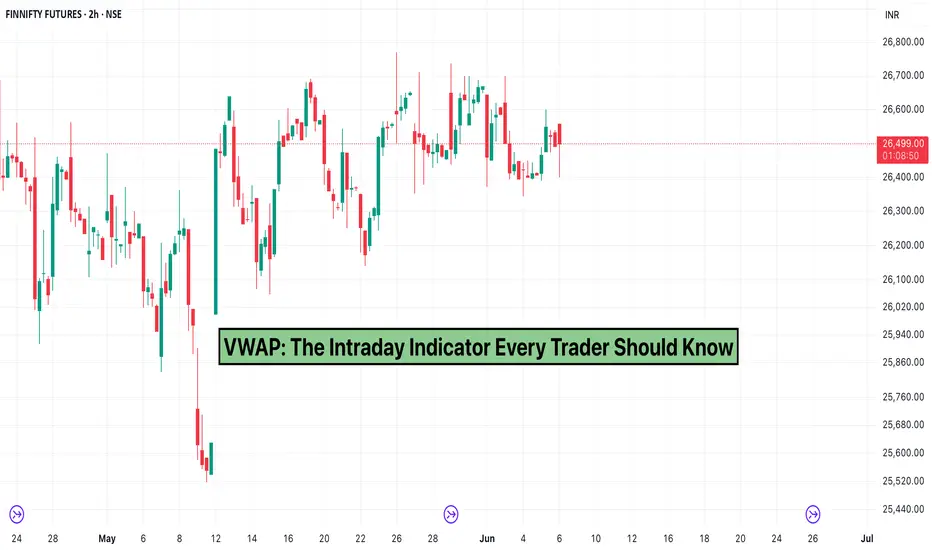
VWAP: The Intraday Indicator Every Trader Should KnowWhen it comes to intraday trading, precision matters. That’s where VWAP—the Volume Weighted Average Price comes in.
Used by retail traders, institutional players, and algo systems alike, VWAP helps you understand the average price of a security throughout the day, weighted by volume. It's one of the most important indicators for intraday decision-making on platforms like TradingView.
What is VWAP?
VWAP is the average price a security has traded at throughout the day, based not just on price but also on volume. It gives more importance to price levels with higher volume, making it a reliable benchmark for assessing price fairness and trend direction.
Why VWAP Matters
Intraday Trend Gauge: Traders use VWAP to identify whether the price is trading above or below its average.
Support & Resistance: VWAP often acts as dynamic support or resistance during the trading day.
Institutional Benchmark: Many institutional traders use VWAP to ensure they’re getting good execution on large orders.
How to Use VWAP in Your Trading
Above VWAP: Bullish bias. Consider long trades when price holds above VWAP.
Below VWAP: Bearish bias. Look for short setups when price stays below VWAP.
Pullback Entries: Traders often use VWAP for entries on pullbacks during a trending day.
VWAP on TradingView
To use VWAP on TradingView:
Open any intraday chart.
Search for the VWAP indicator in the Indicators tab.
Apply it to your chart—no custom settings needed for the basic version.
You can also experiment with anchored VWAPs or custom scripts that fit your strategy better.
Conclusion
VWAP is more than just a line it’s a real-time gauge of value and trend. It helps traders stay on the right side of momentum while managing entries and exits more effectively.
Whether you’re scalping or holding intraday positions, understanding VWAP can add a powerful edge to your trading setup.
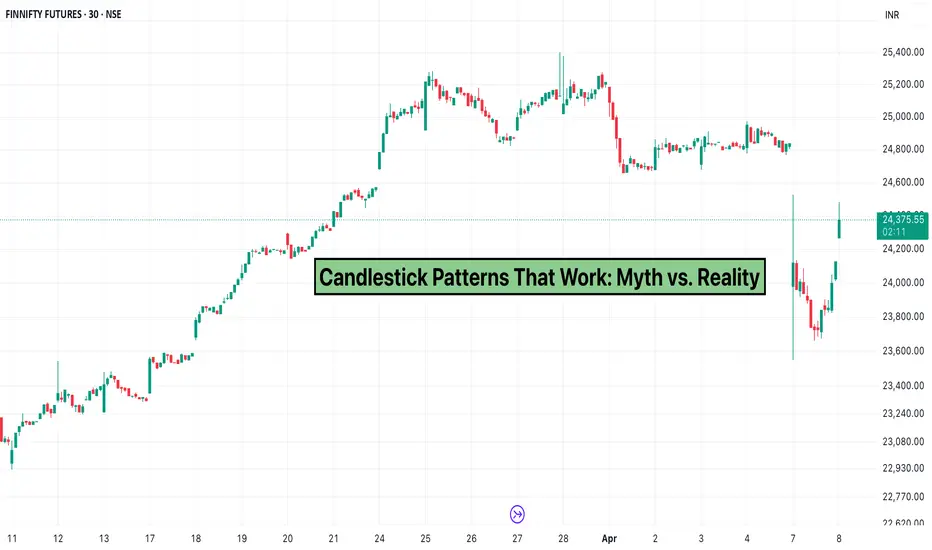
Candlestick Patterns That Work: Myth vs. RealityCandlestick patterns have long been a favorite among technical traders.
From engulfing candles to dojis and hammers, these formations aim to predict market direction based on price action.
But with so many patterns and interpretations floating around, it’s important to ask: which candlestick patterns truly work—and which are overhyped?
The Promise of Candlestick Patterns
Candlestick patterns are used to spot potential reversals, continuations, and indecision in the market. Traders often rely on them for entry and exit points, assuming that price behaves in recognizable, repeatable ways.
Popular patterns include:
Bullish Engulfing : Signals a potential upward reversal.
Bearish Engulfing : Suggests a possible trend shift downward.
Hammer & Hanging Man : Appear at the end of trends and hint at reversals.
Doji : Represents indecision; can signal a turning point when confirmed by other factors.
The Reality Check
While some patterns can be reliable in specific contexts, candlestick signals alone aren’t foolproof. Here's why:
Lack of Context : A hammer in a strong downtrend doesn’t always mean a reversal is coming.
False Signals : Markets are driven by volume, news, and macro conditions—candles can be misleading without confirmation.
Overfitting : Traders often cherry-pick successful patterns in hindsight, ignoring the ones that failed.
What Actually Works?
Confirmation is key : Pair candlestick patterns with volume, support/resistance, or indicators like RSI or MACD.
Backtesting helps : Use TradingView’s tools to test the performance of patterns over time.
Context matters : Patterns work better at key levels—like after a breakout, near trendlines, or at major support zones.
Conclusion
Candlestick patterns are helpful, but they’re not magic. To truly make them work, you need confirmation, context, and a strong understanding of market behavior. Use them as part of your toolkit—not the entire strategy.
Have you found success with candlestick patterns?
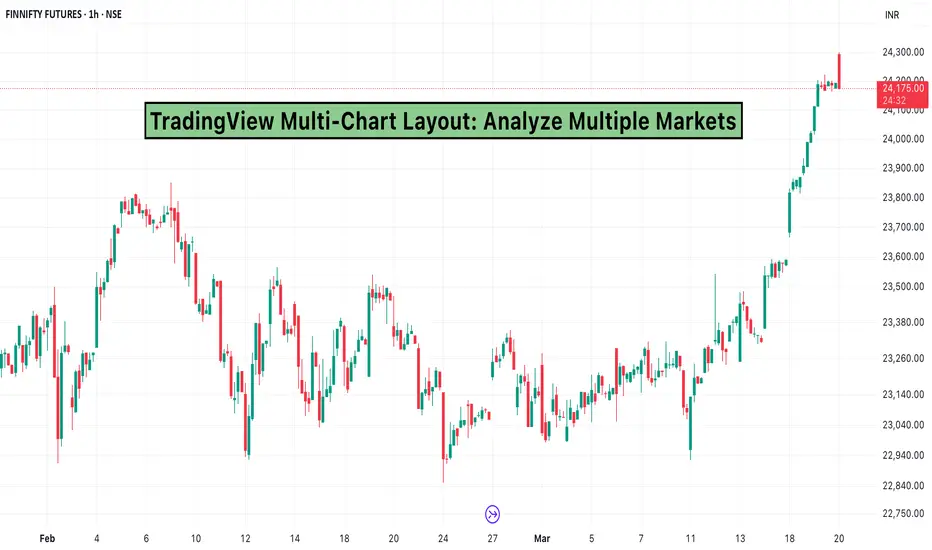
TradingView Multi-Chart Layout: Analyze Multiple MarketsEffective market analysis requires tracking multiple assets simultaneously. TradingView’s multi-chart layout allows traders to monitor different markets, time frames, and instruments within a single workspace.
1. Why Use the Multi-Chart Layout?
Compare Different Markets: Analyze stocks, forex pairs, and commodities side by side.
Monitor Multiple Time Frames: Track short-term trends while keeping an eye on the bigger picture.
Improve Efficiency: Avoid switching between tabs and maintain a seamless trading experience.
Enhance Strategy Execution: Spot correlations and divergences across different instruments.
2. How to Set Up a Multi-Chart Layout in TradingView
Open the TradingView Chart – Start by launching the TradingView platform.
Select the Multi-Chart Layout – Click on the "Select Layout" option in the toolbar and choose from available configurations (2, 4, 6, or more charts per screen).
Add Different Markets or Time Frames – Assign each section of the layout to a different asset, index, or time frame.
Sync Chart Settings – Enable options like synchronized time frames, crosshairs, and drawings for seamless comparisons.
Customize Each Chart – Apply indicators, change themes, and adjust chart types to fit your analysis.
3. Best Practices for Using Multi-Chart Layouts
Use Different Time Frames for the Same Asset: Helps in confirming trends before making a trade.
Compare Correlated Assets: Track movements in related markets, such as gold and the US dollar.
Monitor Leading Indicators: Watch for signals in major indices before entering trades in individual stocks.
Keep the Layout Organized: Avoid clutter by using only the necessary number of charts for your strategy.
4. Who Should Use Multi-Chart Layouts?
Day Traders: Quickly compare assets and spot opportunities in real time.
Swing Traders: Analyze market trends across different time frames before entering trades.
Portfolio Managers: Track multiple holdings simultaneously to manage risk effectively.
Macro Analysts: Compare global markets and intermarket relationships.
Conclusion
The TradingView multi-chart layout is a powerful tool that helps traders analyze multiple markets efficiently. Whether you are tracking stocks, forex, or commodities, using this feature can enhance decision-making and improve your trading strategy.
Fin nifty form Inverse H&S pattern.Fin nifty form Inverse H&S pattern. It has been broken the neckline of pattern. if any dip come for return move can buy /add more fin nifty stocks. like Bajaj fin, Bajaj finserve.

Finnifty moments for option trading 21/Nov/2024Finnifty moments for option trading 21/Nov/2024
follow us for more updates and information.

Finnifty - Oct 8Morning session was trending and afternoon session was choppy today. We have a big consolidation zone now.
Buy above 23440 with the stop loss of 23400 for the targets 23480, 23520, 23560 and 23620.
Sell below 23360 with the stop loss of 23400 for the targets 23320, 23280, 23240, 23200 and 23160.
Check the live market updates.
Hit the like button to Rock !! Show some energy !!
Note : This is my pre market analysis and my trading journal. Not a suggestion to buy or sell.
You are responsible for whatever you do.

FINNIFTY1! // level // 1dNifty Financial Services Index, you can follow this approach:
Support Levels
Recent Lows: Identify significant low points over the past few weeks or months. For example, if FINNIFTY recently dropped to around 18,500, that could be a support level.
Moving Averages: Check the 50-day and 200-day moving averages, which can act as dynamic support levels.
Previous Support Areas: Historical price levels where the index has bounced back can also indicate support.
Resistance Levels
Recent Highs: Determine the highest points in recent trading sessions. If FINNIFTY peaked at around 19,000, that might serve as a resistance level.
Trend Lines: Draw trend lines across recent highs to visualize potential resistance areas.
Psychological Levels: Round numbers, like 19,000 or 19,500, often act as resistance.
Example Analysis (Hypothetical)
Support Level: 18,500 (recent low)
Resistance Level: 19,000 (recent high)

Finnifty - Oct 1Price is consolidating after giving good fall. Sustaining above the current level is important to be bullish.
Buy above 24720 with the stop loss of 24680 for the targets 24760, 24800, 24840 and 24880.
Sell below 24640 with the stop loss of 24680 for the targets 24600, 24560, 24520, 24480 and 24400.
Check the live market updates.
Hit the like button to Rock !! Show some energy !!
Note : This is my pre market analysis and my trading journal. Not a suggestion to buy or sell.
You are responsible for whatever you do.

19Sep2024 - FIN NIFTY Predictiosn (next trading Day)Based on your provided FIN Nifty daily and 5-minute time frame charts, here is the specific analysis:
1. Support and Resistance Levels for Next Trading Day:
Support Levels:
24,200: Strong psychological and technical support.
24,100: A more conservative support level in case of a deeper correction.
Resistance Levels:
24,450: Immediate resistance based on today's high.
24,600: Potential resistance if the market remains bullish, as it approaches this round number.
2. Scenario for Next Trading Day:
9:15 - 10:30 Slight Gap Up or Flat Bullish start, likely pushing towards 24,450 resistance
10:30 - 12:30 Continuing Bullish Momentum Potential to breach 24,450, heading towards 24,600
12:30 - 2:30 Possible Pullback to Support Levels Range-bound or slight pullback near 24,300–24,350
2:30 - 3:30 End of Day Movement Depending on volume, a bullish rally to close near 24,450-24,500
3. Effective Options Buying Strategy:
Strikes for Next Trading Day:
Buy 24,300 CE if market opens flat or slight gap up, and if the bullish scenario plays out as expected.
Buy 24,200 PE if there is a sharp reversal around resistance levels (24,450).
Ideal Time to Enter:
For Call Options (CE), enter during the first hour if the market shows strength.
For Put Options (PE), enter around mid-day if a pullback is observed near resistance.
These levels and scenarios are purely based on the chart's technical structure. You can adjust your strategies based on live data to manage risk and optimize gains.
Disclaimer: Do Manager your Risk and Money management, Do not Forget to PUT STOP LOSS.

FINNIFTY1! (Nifty 50 Index) Looking good today FINNIFTY1! (Nifty 50 Index)
Support Levels:
Fibonacci Level: 16,500 (23.6% Fibonacci retracement of the 2022-2023 rally)
Trend Line: 16,400 (the lower end of the ascending trend channel)
Psychological Level: 16,300 (a significant round number)
Resistance Levels:
Fibonacci Level: 17,100 (61.8% Fibonacci retracement of the 2022-2023 rally)
Trend Line: 17,200 (the upper end of the ascending trend channel)
Psychological Level: 17,300 (another significant round number)

How do Indicators Work in Trading?Trading indicators are essential tools that help traders analyze market trends and make better decisions.
By using historical price data and various mathematical formulas, these indicators provide insights into market conditions and potential future movements.
Whether you are tracking moving averages, measuring volatility with Bollinger Bands, or assessing momentum with the RSI, each of these indicators has its own advantages.
This article provides an overview of how trading indicators work and effective ways to use them for making trading decisions.
What Are Trading Indicators?
Trading indicators are tools used by traders to make informed decisions when analyzing and interpreting financial market data.
They are mathematical calculations based on historical price, volume, or open interest data, and they generate visual signals or patterns on trading charts.
These indicators can reveal trends, momentum, volatility, and market strength, assisting traders in predicting future price movements.
Commonly used types include moving averages that display the average price over a specific period of time and Relative Strength Index (RSI) that assesses how quickly and dramatically prices change.
Through comprehending and applying these indicators, traders can improve their market analysis and trading strategies.
How Do Indicators Work?
The truth is that trading indicators don't actually 'work' in the sense of predicting future prices. Instead, they reflect the market's psychology, showing how current prices compare to past ones, which can guide traders. When combined with candlestick patterns, these tools can help shape your technical analysis strategy.
For instance, indicators can suggest where to place a stop-loss order to minimize risk when closing a trade.
Using trading indicators is particularly valuable if you want to keep emotions out of your trading decisions or avoid being influenced by others' opinions.
Types of Trading Indicators
Traders use various types of trading indicators to analyze market trends and make informed decisions. Here are some of the most popular trading indicators:
1. Trend Indicators
Trend indicators help traders to recognize the intensity and direction of trends in a market. This helps them know whether a particular asset is in an uptrend, a downtrend, or moving sideways.
Common examples include Moving Averages (MA) and Moving Average Convergence Divergence (MACD). Moving Averages smooth out price data over a specified period, making it easier to spot the trend direction. MACD, on the other hand, shows the relationship between two moving averages, signaling potential trend changes.
These indicators are crucial for traders to align their strategies with the prevailing market direction and optimize their entry and exit points.
2. Momentum Indicators
Momentum indicators measure the speed or velocity of price movements to identify overbought or oversold conditions. They help traders gauge the strength of a price trend and anticipate potential reversals.
Examples of these indicators are: the Relative Strength Index (RSI) and the Stochastic Oscillator.
The RSI measures the size of recent gains versus recent losses to show if an asset is overbought or oversold. The Stochastic Oscillator compares a closing price to its price range over a specific period, also identifying overbought or oversold levels.
These indicators are essential for traders to assess market momentum and make informed trading decisions.
3. Volatility Indicators
Volatility indicators measure the rate of price fluctuations over a given period, helping traders understand market conditions.
Common examples are Bollinger Bands and Average True Range (ATR).
Bollinger Bands consist of a middle band (simple moving average) and two outer bands (standard deviations), indicating volatility levels and potential price reversals.
ATR gauges market volatility by averaging the true range over a set period. The true range includes the highest minus the lowest price of the current period, the absolute difference between the current high and the previous close, and the absolute difference between the current low and the previous close.
These indicators help in assessing market risk and potential price movements.
4. Volume Indicators
Volume indicators analyze trading activity to confirm price movements' strengths or weaknesses. By examining the volume of trades, these indicators reveal whether market participants support a price trend.
Common examples include On-Balance Volume (OBV) and the Volume Oscillator. OBV tracks buying and selling pressure by adding the volume on days when prices go up and subtracting it on days when prices go down. The Volume Oscillator compares two moving averages of volume to gauge trend strength.
These indicators help traders identify potential trend reversals, validate price movements, and make more informed trading decisions based on the activity behind price changes.
Conclusion
Trading indicators are powerful tools that can significantly improve your trading strategy. By providing valuable insights into market trends and conditions, they help traders make more informed decisions.
While it's important to understand their limitations, combining different indicators and customizing them to your trading style can lead to better results.

Finnifty - Aug 27Price is consolidating after giving good up move. Sustaining above the current level is important to be bullish.
Buy above 23420 with the stop loss of 23380 for the targets 23460, 23500, 23540 and 23580.
Sell below 22340 with the stop loss of 23380 for the targets 23300, 23260, 23220, 23180 and 22140.
Check the live market updates.
Hit the like button to Rock !! Show some energy !!
Note : This is my pre market analysis and my trading journal. Not a suggestion to buy or sell.
You are responsible for whatever you do.

Finnifty - Aug 20Movement was choppy today. 22900 acted as support so far. Patterns seen in chart are channel formation which can be taken as bull flag also.
Buy above 23020 with the stop loss of 22980 for the targets 23060, 23120, 23180 and 23240.
Sell below 22880 with the stop loss of 22920 for the targets 22840, 22800, 22760, 22720 and 22680.
Check the live market updates.
Hit the like button to Rock !! Show some energy !!
Note : This is my pre market analysis and my trading journal. Not a suggestion to buy or sell.
You are responsible for whatever you do.

FINNIFTY - EXPIRY TRADE 20 AUGFinnifty expected to give breakout about 23060 (future levels)
Expiry could give good upmove...
Track 20 Aug - 22900 call buy on dip tomorrow ... target open
expecting 23240/23360 to test

Finnifty - Aug 13Price is moving inside a channel and now it is at the lower trend line of the channel(support). And 23000 is an important zone.
Buy above 23080 with the stop loss of 23030 for the targets 23120, 23160, 23220 and 23280.
Sell below 22980 with the stop loss of 23020 for the targets 22940, 22900, 22860, 22830 and 22780.
Check the live market updates.
Hit the like button to Rock !! Show some energy !!
Note : This is my pre market analysis and my trading journal. Not a suggestion to buy or sell.
You are responsible for whatever you do.


FINNIFTY - Day Trading Levels.NSE:FINNIFTY1!
Disclaimer:
Candlestick charts are a tool for understanding market trends, but they do not guarantee future market behaviour. So, This is only for educational purposes only.

Finnifty - Aug 9Price was falling and has formed bearish pennant/triangle pattern. 22800 zone is important to decide the trend direction.
Buy above 22920 with the stop loss of 22880 for the targets 22960, 23000, 23080 and 23120.
Sell below 22820 with the stop loss of 22860 for the targets 22780, 22720, 22660, 22600 and 22520.
Check the live market updates.
Hit the like button to Rock !! Show some energy !!
Note : This is my pre market analysis and my trading journal. Not a suggestion to buy or sell.
You are responsible for whatever you do.

Finnifty - July 30We had trending move in morning and choppy session in afternoon today. And price is at support now.
Buy above 23320 with the stop loss of 23280 for the targets 23360, 23400, 23440 and 23480.
Sell below 23240 with the stop loss of 23280 for the targets 23200, 23160, 23120 and 23080.
Check the live market updates.
Hit the like button to Rock !! Show some energy !!
Note : This is my pre market analysis and my trading journal. Not a suggestion to buy or sell.
You are responsible for whatever you do.

FinniftyPrice faced resistance at 23720 and unable to break it today. Also price is trying to break the trend line to move up.
Buy above 23660 with the stop loss of 23610 for the targets 23700, 23740, 23790, 23820 and 23880.
Sell below 23560 with the stop loss of 23600 for the targets 23520, 23480, 23420 and 23360.
Check the live market updates.
Hit the like button to Rock !! Show some energy !!
Note : This is my pre market analysis and my trading journal. Not a suggestion to buy or sell.
You are responsible for whatever you do.

Important Points To Trade on Budget dayImportant Points To Trade on Budget day:-
1. For option buyers, only trade in Finnifty because tomorrow is Finnifty’s weekly expiry and premiums will be lower than others, resulting in lower risk.
2. Don’t take any trades before 12:00 PM, as mornings on Budget days usually have low volatility due to uncertainty.
3. The Finance Minister’s speech typically starts between 11:30 AM and 12:30 PM.
4. For option buyers, the 12:30 PM 15-minute candle is important.
5. On Budget days after 1:00 PM, when momentum starts, the 15-minute lows and highs usually stay protected, so you can trail your Stoploss on the 15-minute candle.
6. If you take a position in option buying after 1:00 PM, do not hold your trade if any 15-minute candle’s low or high breaks after a directional move. There is a high chance of reversal when this happens.
7. Expect trade reversals between 1:00 PM and 2:00 PM.
