What Time Frame Should You Trade?What Time Frame Should You Trade?
When it comes to trading in the financial markets, choosing the right time frame can significantly impact your success.
A time frame simply means how long you analyze the price movements of a stock or currency before making a trade.
Some traders prefer to analyze prices every minute, while others prefer to watch them over days or weeks. Each time frame has its advantages and challenges.
In this article, we'll explore different time frames—like short-term, medium-term, and long-term—and help you decide which one might work best for you.
What is the Time Frame in Trading?
Time frames in trading refer to the specific duration over which price data is aggregated and displayed on a chart. Each time frame represents a different perspective of market movements and is crucial for making trading decisions.
Traders can choose from various time frames such as short-term (like minutes or hours), medium-term (like days or weeks), and long-term (like months or years), depending on their trading strategy, goals, and preferred level of activity in the markets.
The time frame selected significantly influences trading strategies, risk management approaches, and the types of opportunities traders can identify and act upon.
Choosing A Time Frame
In trading, your success depends on choosing the right time frame that fits how you like to trade. There are different methods and strategies for different time frames, so picking the right one is really important.
1. Short-Term Time Frames
Typically, in trading, short-term time frames refer to charts where one candlestick or bar represents a relatively brief period such as minute(s) or hour(s).
These time frames are mostly used by traders for quick analysis and decision-making. Some examples include:
1 minute chart: Every candlestick symbolizes one minute during which trade took place. It is very short term, used for intraday trading, to capture quick movements of the price.
5-minute chart: Each candlestick shows the activity of 5 minutes. This is slightly broader than a 1-minute chart but still focuses on intraday trading.
15-minute chart: Each of these candles represents 15 minutes of trading activity. Traders use this timeframe to identify short term trends and patterns within single-session trades.
These short-term periods are useful for market participants who are actively watching the market and making decisions based on the prices that move only within that day itself.
2. Medium-Term Time Frames
Medium-term time frames typically refer to charts or time intervals in technical analysis that range from several weeks to several months.
These time frames are commonly used by traders and analysts to analyze trends, patterns, and price movements that occur over a span longer than short-term (intraday to a few days) but shorter than long-term (years).
Here are some common examples of medium-term time frames:
4-Hourly Charts (4H): Each candlestick or bar represents price action over a 4-hour period. Traders often use these charts to identify shorter-term trends within a medium-term context.
Daily Charts: Each candlestick or bar represents price action over one trading day. Daily charts are widely used to analyze medium-term trends and key levels.
Weekly Charts:Each candlestick or bar represents price action over one week. These charts are useful for identifying trends and significant support/resistance levels over several months.
2-Week or Monthly Charts: Some traders might consider these as longer medium-term time frames, where each candlestick or bar represents price action over 2 weeks or a month. These are useful for identifying broader trends and major support/resistance levels over several months.
Medium-term time frames are valuable because they provide a balance between capturing significant market movements and avoiding the noise that shorter-term time frames can sometimes exhibit.
They are particularly useful for swing traders and investors who aim to capitalize on trends that unfold over weeks to months.
3. Long-Term Trading
Long-term time frames in trading typically refer to charts or analyses conducted over extended periods, such as several months to years.
They are used by investors and traders to identify broader trends and make decisions based on long-term market movements rather than short-term fluctuations.
Long-term time frames are valuable for understanding the overall direction of a financial instrument or market, filtering out noise that may be prevalent in shorter time frames.
This approach is often associated with strategies like long-term investing or trend following, where decisions are based on fundamental factors or significant technical patterns that unfold over longer periods.
Choosing the Right Time Frame to Trade
The choice of time frame for trading depends on your trading style, risk tolerance, and time commitment.
Short-term time frames like minutes to hours are suitable for day traders who make quick decisions based on real-time data.
Medium-term time frames, such as a few days to weeks, are ideal for swing traders who take advantage of price patterns and trends.
Long-term time frames, spanning weeks to months or even years, are preferred by position traders or investors who rely more on fundamental analysis.
It’s important to choose a time frame that aligns with your trading strategy and personal circumstances.
Conclusion
Choosing the right time frame for trading is very important. It directly impacts how you analyze markets, make decisions, and manage risks. Whether you prefer short-term action or a longer-term view, aligning your time frame with your trading strategy is key to success.
Remember, consistency and adaptation to market conditions are essential. Experimentation and learning from experience will help you find the time frame that best suits your goals and style.
FINNIFTY1! trade ideas

FINNIFTY FUT ExpiryHi just sharing a view of Finnifty Futures, as we got expiry today and tomorrow is a holiday so both Banknifty & Finnifty has weekly expiry today. As per Option chain open interest its showing huge writing at 23700 to 23750 on Calls for now, needed to check later when a level is taken off either side. Support resistance trendlines marked, Channel marked, this is Just a View Not a Reco...
Please do check Gamma of an Option before you initiate a trade, as Gamma blast can happen today but not sure.
Please consult your financial advisor before you initiate a trade. Please don't make a trade on my views as these are my personal views and sharing for education purpose only.

Finnifty - July 16Price was moving in a range for the past two days and was choppy. Unless price gains strength, the movement will be in the range.
Buy above 23780 with the stop loss of 23740 for the targets 23820, 23860, 23900 and 23960.
Sell below 23680 with the stop loss of 23720 for the targets 23640, 23600, 23560 and 23520.
Check the live market updates.
Hit the like button to Rock !! Show some energy !!
Note : This is my pre market analysis and my trading journal. Not a suggestion to buy or sell.
You are responsible for whatever you do.

Are You Using RSI Indicator the Right Way?Have you ever wondered how traders predict whether a stock is about to rise or fall? One tool they use is called the Relative Strength Index, or RSI.
It's like a weather forecast for stocks, helping traders see if a stock is 'overbought' or 'oversold.' However, using RSI isn’t only about being familiar with these words, it’s about using them correctly.
This article will look at what RSI is, the mistakes people commonly make when using it, and how it can be used properly for making informed decisions in the share market.
What is the RSI Indicator?
Developed by J. Welles Wilder Jr., The Relative Strength Index (RSI) is a widely-used momentum oscillator in technical analysis that assesses the speed and change of price movements.
It oscillates between 0 and 100 as a line graph, reflecting recent gains versus losses over a defined period (usually 14 days).
This comparison helps traders determine whether an asset is overbought or oversold, signaling potential reversal points or confirming trends.
Traders use RSI to identify potential reversal points, confirm trends, and assess the strength of price movements. It's a valuable tool for making informed trading decisions based on market momentum.
Common Misuses of RSI
Traders often misuse the RSI in several ways:
Over Reliance on extreme RSI levels: Traders often fall into the trap of buying or selling solely based on RSI reaching extreme levels, such as above 70 (overbought) or below 30 (oversold).
This can lead to premature trading decisions without considering other factors like market trends or fundamental analysis.
Ignoring divergence signals: RSI divergence occurs when the price trend and RSI trend move in opposite directions.
Traders sometimes overlook these signals, which can indicate potential reversals or continuations in price movements.
Misinterpretation in Sideways Markets: One limitation of the RSI indicator is that it can generate false signals in ranging or sideways markets.
This means that during periods when prices are not trending strongly in one direction, the RSI may give misleading indications of overbought or oversold conditions
Using RSI in isolation without confirmation: RSI should ideally be used in conjunction with other technical indicators or analysis methods.
Depending solely on RSI readings without confirming signals from other indicators or price action can result in unreliable trading decisions.
These misuses highlight the importance of understanding RSI within the broader context of technical analysis and using it as part of a comprehensive trading strategy rather than as a standalone tool.
Best Practices for Using RSI Effectively
Using the Relative Strength Index (RSI) effectively involves several best practices:
1. Understanding Overbought and Oversold Levels
RSI ranges from 0 to 100. A reading above 70 suggests the market is overbought, possibly signaling a sell opportunity.
On the other hand, if the reading falls below 30, it indicates oversold conditions, suggesting a potential opportunity to buy. Confirmation with price trends means aligning RSI signals with the direction of the market.
These levels help traders gauge when a market might be reaching extremes, aiding in decision-making for entering or exiting trades.
2. Divergence Analysis
Divergence analysis with RSI compares its movements to price trends. Bullish divergence happens when prices make lower lows while the RSI makes higher lows, suggesting a potential uptrend.
A bearish divergence occurs when prices make higher highs while the RSI makes lower highs, indicating a potential downtrend.
These divergences can signal shifts in momentum and potential opportunities for traders to consider reversals in market direction.
3. Use in Conjunction with Other Indicators
Using RSI with other indicators means combining its signals with those of different tools like moving averages or trendlines.
This approach helps confirm trading signals, providing more robust insights into market trends and potential reversals.
For instance, if the RSI signals oversold conditions but a moving average confirms a downtrend, it suggests a stronger sell signal.
This method reduces reliance on RSI alone and enhances decision-making by considering multiple aspects of market behavior simultaneously.
4. Timeframe Consideration
Adjust the timeframe of RSI based on your trading goals. Short-term traders often use a 14-day RSI for quick market movements.
Long-term investors might prefer a 50-day RSI to capture broader trends and filter out short-term fluctuations.
Choosing the right time frame aligns RSI signals with your trading horizon, helping you make more informed decisions.
5. Risk Management
Risk management with RSI involves using stop-loss orders to limit potential losses. Even though RSI signals can indicate buying or selling opportunities, they're not foolproof.
Setting a stop-loss helps safeguard against unexpected market movements that could invalidate RSI signals, ensuring you exit trades before losses become significant.
This approach balances the potential benefits of RSI with protection against downside risks, supporting more disciplined and sustainable trading strategies.
Conclusion
Remember, using RSI wisely can greatly improve your trading success. By avoiding common mistakes and applying the tips discussed, you'll be better equipped to interpret market signals effectively.
Whether you're trading stocks or other assets, mastering RSI can make a big difference.

Finnifty - July 9Price is moving in a channel and 23600 is an important zone to decide the trend direction.
Buy above 23620 with the stop loss of 23580 for the targets 23660, 23700, 23740 and 23780.
Sell below 23540 with the stop loss of 23580 for the targets 23500, 23460, 23420 and 23380.
Check the live market updates.
Hit the like button to Rock !! Show some energy !!
Note : This is my pre market analysis and my trading journal. Not a suggestion to buy or sell.
You are responsible for whatever you do.

FinniftyPrice is moving in a channel and now it is testing the upper trend line. The price may fall towards lower trend line or it can move up.
Buy above 23720 with the stop loss of 23680 for the targets 23760, 23800, 23840 and 23880.
Sell below 23620 with the stop loss of 23660 for the targets 23580, 23540, 23500 and 23460.
Check the live market updates.
Hit the like button to Rock !! Show some energy !!
Note : This is my pre market analysis and my trading journal. Not a suggestion to buy or sell.
You are responsible for whatever you do.

Tomorrow is Fin Nifty Expiry it may be in Range BoundFin nifty is expiry today and chances are its in Range bound and if it breaks its range it move upper side

10 Most Popular & Trusted Chart Patterns10 Most Popular & Trusted Chart Patterns
Chart patterns are crucial tools for traders to predict price movements in financial markets. They help traders predict future trends and the direction of a stock or any other security.
In this article, we'll explore the 10 most popular and trusted chart patterns, covering both continuation patterns that signal a trend's persistence and reversal patterns that indicate a trend change.
10 Popular and Trusted Chart Patterns
These are 10 of the popular and reliable chart patterns used for technical analysis as below.
1. Head and Shoulders
The head and shoulders pattern on a chart features a prominent peak with two smaller peaks on either side. Traders analyze this pattern to anticipate a shift from bullish to bearish trends.
Usually, the first and third peaks are smaller than the central peak, and they all retreat to a common support level called the 'neckline'.
When the third peak declines to this support level, it often leads to a breakout into a bearish downtrend.
2. Double Top/Bottom
The Double Top pattern is a chart formation indicating a potential trend reversal in trading markets. It forms after an uptrend when the price reaches a peak (the first top), retraces, and then rises again to a similar peak (the second top), forming a resistance level.
This pattern suggests that buyers are becoming less aggressive, potentially leading to a downtrend as sellers gain control and push prices lower after failing to surpass the resistance level.
3. Double Bottom
The double bottom on the charts indicates a change in market direction from bearishness to possible bullishness.
It appears after downtrends when the price goes down to a low level twice (as two ‘bottoms’) but it does not decline further on each occasion.
This pattern suggests that selling pressure has weakened and buyers may start pushing prices higher. Traders often see it as a signal to anticipate a potential upward movement in the market.
4. Rounding Bottom
The Rounding Bottom, or saucer bottom, is a bullish chart pattern signaling a potential reversal from a downtrend to an uptrend.
It occurs when prices gradually dip to a low point and then start rising slowly and steadily in a curved shape like a bowl.
Traders look for this pattern as it suggests a shift in sentiment from selling pressure to buying interest, indicating a possible opportunity to enter long positions as the trend reverses upwards.
5. Cup and Handle
The cup and handle pattern is bullish and indicates a brief period of negative market sentiment before the main uptrend resumes.
The cup resembles a rounding bottom pattern, while the handle resembles a wedge pattern, as discussed later.
After forming the rounding bottom, there's typically a temporary pullback called the handle, confined within parallel lines on the price chart.
The asset eventually breaks out of this handle phase and continues its upward trend.
6. Wedges
Wedge patterns in trading are formed by converging trendlines that slope either upward or downward.
A rising wedge is bearish, suggesting potential price declines, as the highs and lows tighten over time.
On the other hand, a falling wedge is bullish, indicating potential price increases, as the highs and lows also converge but in a downward direction.
Traders look for breakouts from these patterns to confirm trend continuations or reversals, using them to anticipate future price movements in the market.
7. Pennant or Flags
A pennant is a short-term chart pattern that forms after a strong price movement, resembling a small symmetrical triangle.
It represents a temporary consolidation or pause in the trend, where the price moves within converging trendlines that resemble a pennant shape.
Typically, a pennant is a continuation pattern, suggesting that after the brief consolidation, the prior trend is likely to resume.
Traders often watch for a breakout above or below the pennant's trendlines to confirm the direction of the next significant price movement.
8. Ascending Triangle
An ascending triangle is a bullish pattern. It forms when the price moves upward within a confined area, with a flat resistance level and a rising support trendline.
Traders interpret this pattern as a sign of increasing buying pressure as the price repeatedly tests the resistance level.
Typically, when the price breaks above the horizontal resistance line of the triangle, it often continues upward, making it a potential signal for traders to enter long positions or to expect further bullish movement in the market.
9. Descending Triangle
The Descending Triangle pattern is a bearish continuation pattern in technical analysis. It forms when the price action creates a horizontal line (support) and a descending trendline (resistance).
Traders interpret this pattern as a signal that the downtrend is likely to continue, as sellers become more aggressive near the resistance level while buyers fail to push the price higher.
10. Symmetrical Triangle
The symmetrical triangle pattern in technical analysis shows a period of indecision in the market, with converging trendlines forming a triangle shape. It doesn't indicate a clear bullish or bearish bias initially.
Traders watch for a breakout above the upper trendline for a potential bullish continuation or below the lower trendline for a potential bearish reversal.
It's important to confirm the breakout with increased volume to validate the pattern's significance.
Conclusion
Learning about chart patterns helps you understand how markets behave. While these patterns give important clues, remember that no strategy always works perfectly.
It's important to use them with other indicators and manage risks carefully. By being patient and staying disciplined, you can make informed decisions that fit your trading plans.

FinniftyPrice is moving within the range of 22800 to 23150 for few days. Now it is at 23150 zone. The possibilities are 1. Price can take support from 23150 zone. 2. Price can face resistance and fall towards 22800. 3. Price can move within the range without proper trend direction.
Buy above 23160 with the stop loss of 23110 for the targets 23210, 23260, 23300 and 23340.
Sell below 22980 with the stop loss of 23040 for the targets 22940, 22900, 22840 and 22800.
Check the live market updates.
Hit the like button to Rock !! Show some energy !!
Note : This is my pre market analysis and my trading journal. Not a suggestion to buy or sell.
You are responsible for whatever you do.

FinniftyWe had a very good movement today. Trend deciding level/zone is 21900 and price is taking support from it.
Buy above 22020 with the stop loss of 21980 for the targets 22060, 22100, 22160 and 22200.
Sell below 21880 with the stop loss of 21920 for the targets 21840, 21800, 21760 and 21720.
Check the live market updates.
Hit the like button to Rock !! Show some energy !!
Note : This is my pre market analysis and my trading journal. Not a suggestion to buy or sell.
You are responsible for whatever you do.

FinniftyPrice was volatile and range bound for the past few days. 21500 zone will decide the trend direction.
Buy above 21540 with the stop loss of 21500 for the targets 21580, 21620, 21660 and 21720.
Sell below 21420 with the stop loss of 21460 for the targets 21380, 21340, 21300 and 21280.
Check the live market updates.
Hit the like button to Rock !! Show some energy !!
Note : This is my pre market analysis and my trading journal. Not a suggestion to buy or sell.
You are responsible for whatever you do.

FinniftyPrice is facing double top resistance around the zone 21350 - 21380. This can act as a trend direction deciding level.
Buy above 21400 with the stop loss of 21360 for the targets 21440, 21480, 21520 and 21580.
Sell below 21300 with the stop loss of 21340 for the targets 21260, 21220, 21180 and 21120.
Check the live market updates.
Hit the like button to Rock !! Show some energy !!
Note : This is my pre market analysis and my trading journal. Not a suggestion to buy or sell.
You are responsible for whatever you do.

Finnifty - May 7We had a very narrow range movement today. And we can see the price is at support now. Price has formed a descending triangle pattern also.
Buy above 21840 with the stop loss of 21790 for the targets 21880, 21940, 22000 and 22060.
Sell below 21750 with the stop loss of 21790 for the targets 21710, 21660, 21620 and 21580.
Check the live market updates.
Hit the like button to Rock !! Show some energy !!
Note : This is my pre market analysis and my trading journal. Not a suggestion to buy or sell.
You are responsible for whatever you do.

Finnifty - April 30Price is at the trend deciding zone 21800 - 21840. Will the trending move what we get today will continue tomorrow or the price will reverse?
Buy above 21860 with the stop loss of 21820 for the targets 21900, 21960, 22020 and 22050.
Sell below 21760 with the stop loss of 21800 for the targets 21720, 21660, 21620 and 21580.
Check the live market updates.
Hit the like button to Rock !! Show some energy !!
Note : This is my pre market analysis and my trading journal. Not a suggestion to buy or sell.
You are responsible for whatever you do.

FinniftyPrice is moving by taking the trend line as support. Momentum was less today compared to previous day. Will the trend continue or price will fall?
Buy above 21380 with the stop loss of 21330 for the targets 21420, 21460 and 21520.
Sell below 21280 with the stop loss of 21320 for the targets 21240, 21200, 21160 and 21120.
Hit the like button to Rock !! Show some energy !!
Note : This is my pre market analysis and my trading journal. Not a suggestion to buy or sell.
You are responsible for whatever you do.

FINNIFTY Prepare for short term rallyFINNIFTY technically moving with an upward trend. No major fundamentals are supporting a change in a technical pattern other than the India-Mauritious tax issue on FIIs. But it is unlikely to affect Buying at lower levels
Buy can be initiated between 21000-20500
Make sure that one can Handling 500 points of volatility
800-1000 points can be expected before 7th May 2024
Support: 20500 Resistance: 22500
By Sathish Kavinchal
SEBI Registered Research Analyst
INH200007539
Disclaimer: Investments in the securities market are subject to market risks. Read all the related documents carefully before investing.
FinniftyPrice is testing the support 21150 - 21180. Next support is seen at 20990 - 21020. Resistance is at the zone 21290 - 21320.
Buy above 21180 with the stop loss of 21140 for the targets 21220, 21260, 21300 and 21360.
Sell below 21100 with the stop loss of 21140 for the targets 21060, 21020, 20980 and 20940.
The price will react at the support/resistance levels given above.
Check the live market updates.
Hit the like button to Rock !! Show some energy !!
Note : This is my pre market analysis and my trading journal. Not a suggestion to buy or sell.
You are responsible for whatever you do.

FinniftyThough the price is moving taking the trend line support, it is a slow move and now price is consolidating.
Resistance zone : 21690 - 21720. Support zone : 21500 - 21530.
Buy above 21720 with the stop loss of 21670 for the targets 21760, 21810 and 21880.
Sell below 21620 with the stop loss of 21660 for the targets 21680, 21540 and 21500.
Check the live market updates.
Hit the like button to Rock !! Show some energy !!
Note : This is my pre market analysis and my trading journal. Not a suggestion to buy or sell.
You are responsible for whatever you do.

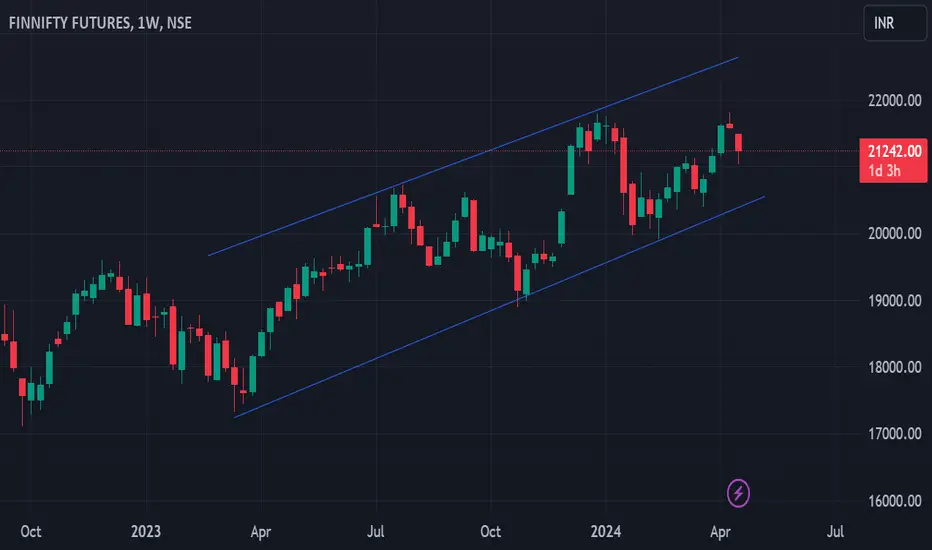
FINNIFTY FUTURES Finnifty Looking bullish in patterns and time, Trend angle looking good with price and pattern confirmation

FinniftyPrice is moving inside a channel, which makes it tough to under the trend direction. Important support is 20480 - 20520. Important resistance is 20720 - 20760.
Buy above 20680 with the stop loss of 20640 for the targets 20720, 20760, 20800 and 20860.
Sell below 20480 with the stop loss of 20530 for the targets 20440, 20400, 20350 and 20300.
If price breaks the above mentioned resistance with volume, then we can expect good movement.
Check the live market updates.
Hit the like button to Rock !! Show some energy !!
Note : This is my pre market analysis and my trading journal. Not a suggestion to buy or sell.
You are responsible for whatever you do.

FinniftyPrice was moving within the range 20900 - 21100 for few days and the range was broken today. Price will be bearish if it stays below the range.
Important resistance - 21100.
Important support - 20700, 20900.
Buy above 20950 with the stop loss of 20900 for the targets 21000, 21040, 21080 and 21120.
Sell below 20850 with the stop loss of 20900 for the targets 20800, 20760, 20720 and 20680.
Check the live market updates.
Hit the like button to Rock !! Show some energy !!
Note : This is my pre market analysis and my trading journal. Not a suggestion to buy or sell.
You are responsible for whatever you do.


