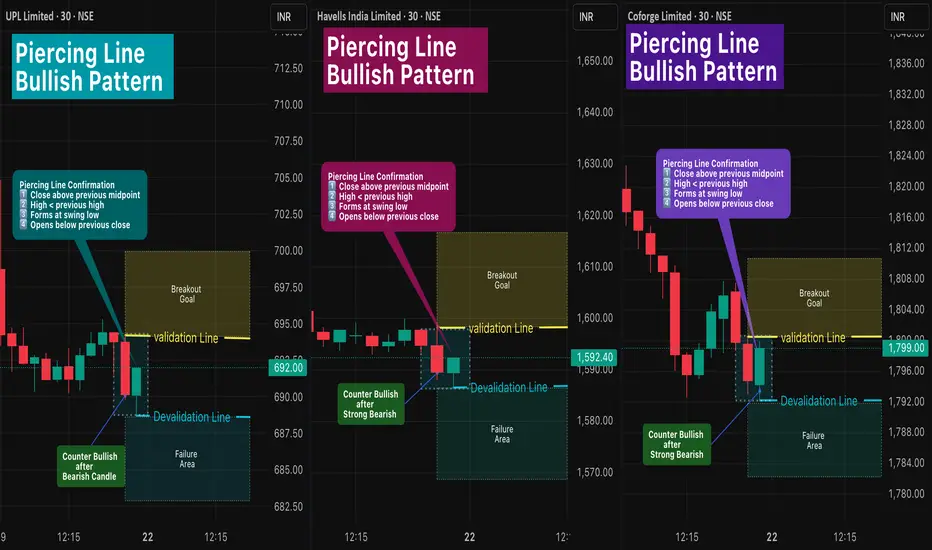
Piercing Line Bullish Pattern 🔎 Intro / Overview
The Piercing Line Pattern is a two-candle bullish reversal setup that forms after a downtrend.
- Sellers lose control → Buyers step in strongly.
- Entry and exit are rule-based using Validation and Devalidation lines to restrict false signals.
- Stop-loss is base
Next report date
—
Report period
—
EPS estimate
—
Revenue estimate
—
22.50 INR
14.72 B INR
217.50 B INR
228.76 M
About Havells India Limited
Sector
Industry
CEO
Anil Rai Gupta
Website
Headquarters
Noida
Founded
1971
ISIN
INE176B01034
FIGI
BBG000D450W5
Havells India Ltd. engages in the development of electrical and power distribution equipment. It operates through the following segments: Switchgears, Cables, Lighting and Fixtures, Electrical Consumer Durables, and Lloyd Consumer. The Switchgear segment comprises of domestic and the industrial switchgears, electrical wiring accessories, industrial motors, pumps, and capacitors. The Lighting and Fixture segment offers energy saving lamps and luminaries. The Cable segment includes flexible cables and industrial underground cables. The Electrical Consumer Durables segment composes of fans, water heaters and domestic appliances. The Lloyd Consumer segment consists of air conditioner, television, washing machine, and domestic appliances. The company was founded by Qimat Rai Gupta in 1971 and is headquartered in Noida, India.
Related stocks
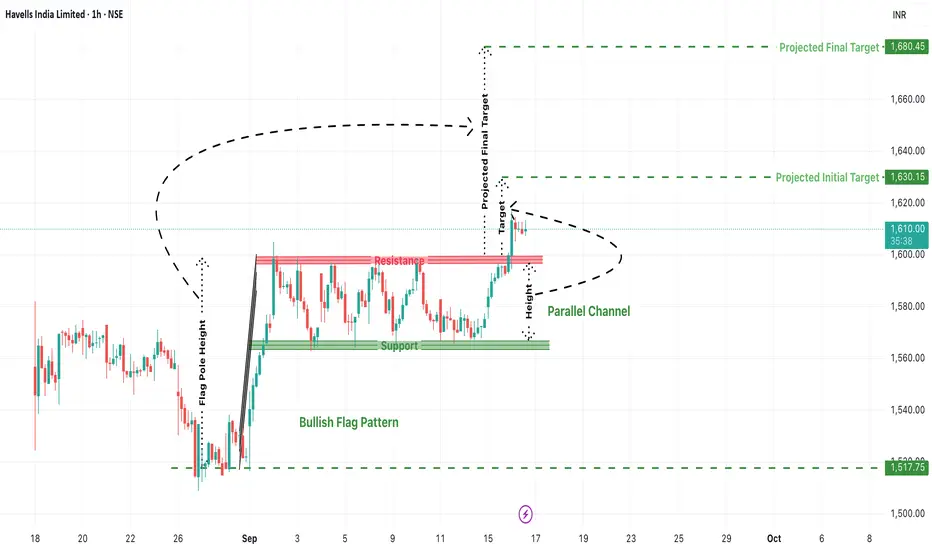
Havells Bullish Flag Breakout: Can We See a Rally to 1680+?Havells India Ltd. is currently showing a classic bullish technical setup—a Bullish Flag Pattern—that could lead to a potential breakout and strong upside movement in the short term. Traders who favor breakout-based strategies should pay close attention to this chart, especially considering the stru
Havells flag n poleHavells flag n pole breakout
Add alerts acc...
Proper consolidation for 2 to 3 phases
Simple Trend Analysis with BreakoutDisclaimer: This is just an a price action analysis of stock Tata Motors. Don't consider this as an stock tip or advice. Invest/Trade at your own risk.
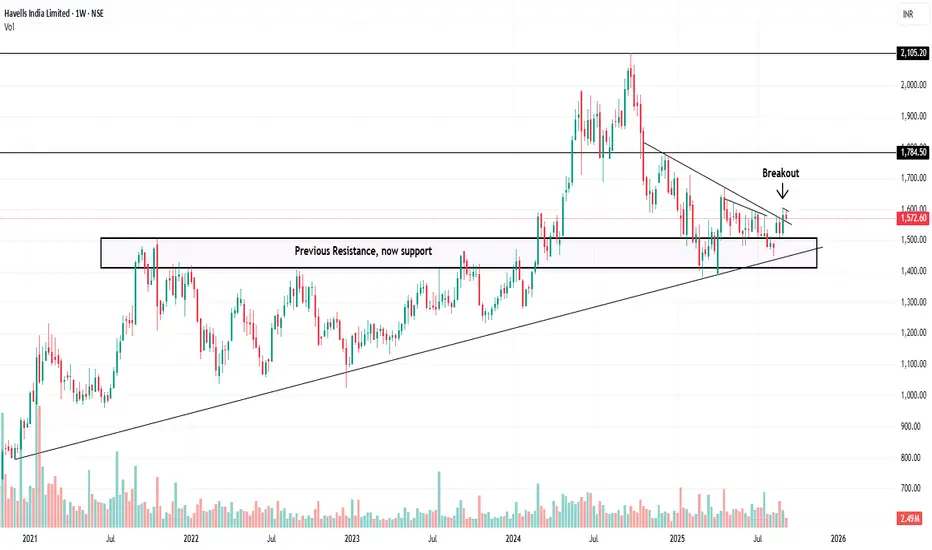
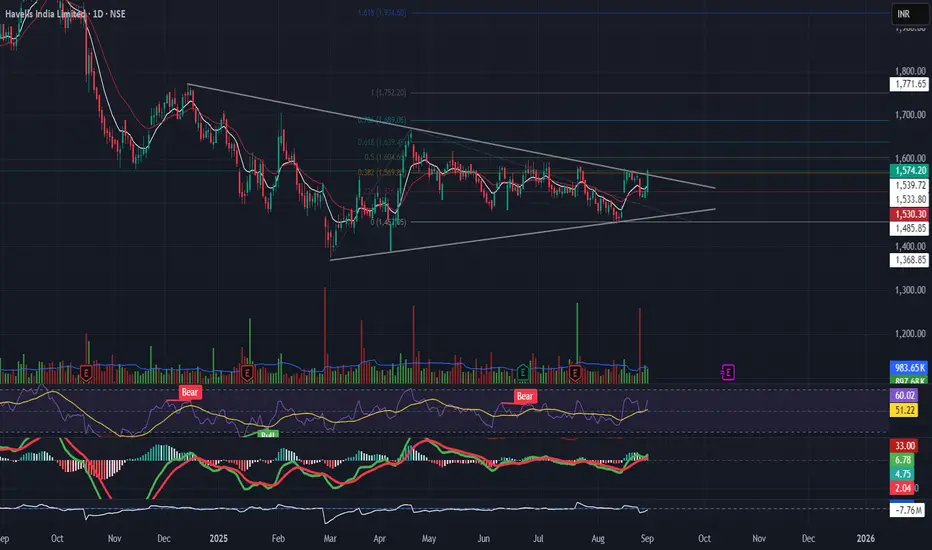
Havells breakout from symmetrical triangle patternHavells had Breakout from symmetrical triangle at the ₹1,570 descending resistance. RSI near 60, MACD recovering and moving up. Watch for volume-backed breakout.
Breakout above can fuel a move to ₹1,690–₹1,750.
Stop near ₹1,485.
🔌 Electrical sector needs confirmation for momentum entry."
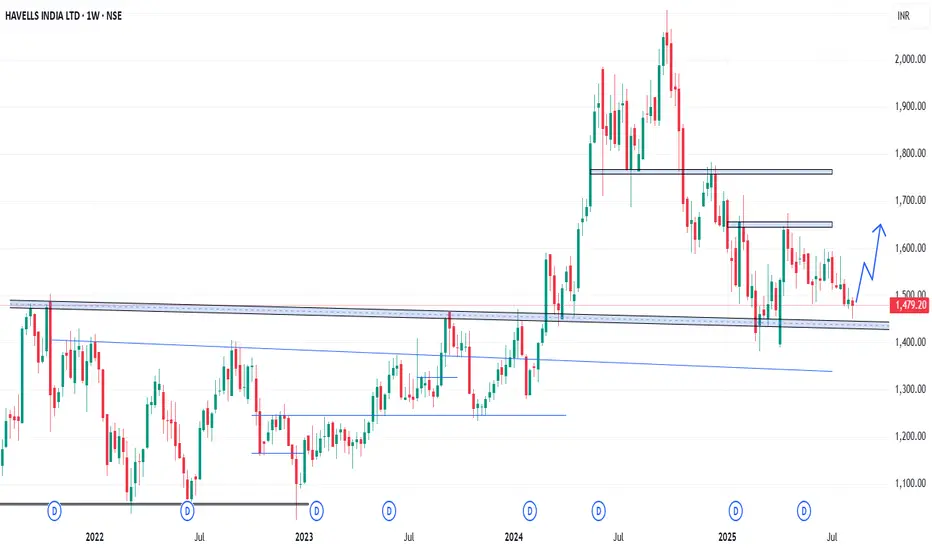
HAVELLS - Weekly AnalysisIn the Weekly Chart of HAVELLS ,
we can see that, it has created a Hammer candle on support.
We can see a bounce back from here.
Expected momentum is shown in chart.
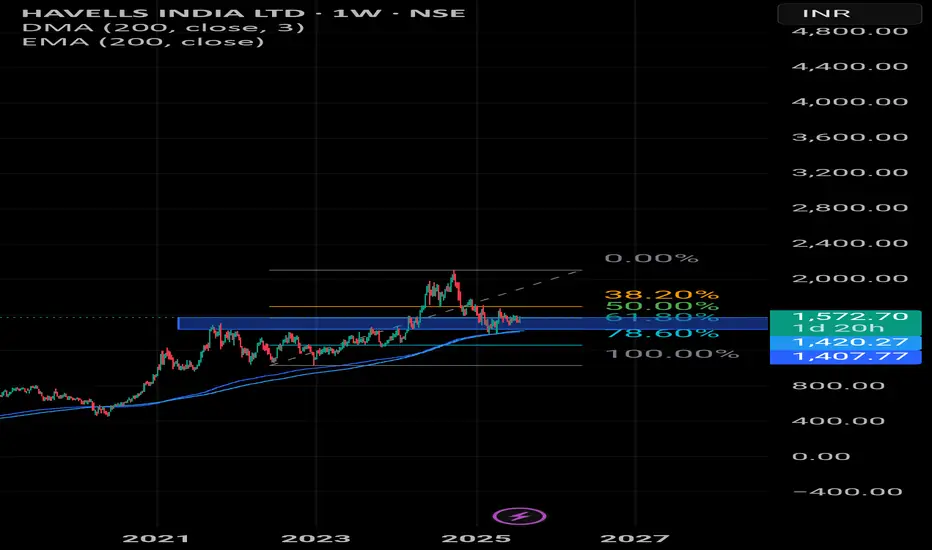
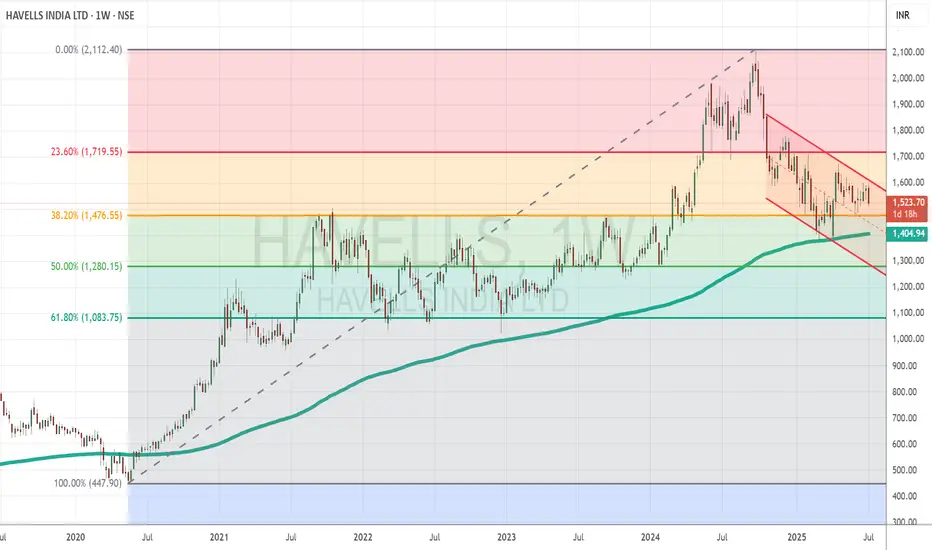
HAVELLS INDIA This stock is looking looking for reversal on weekly timeframe with Fibonacci retracment levels with Ema and dma of 200.
HAVELLS Channel Breakout Setup with Earnings Ahead Havells is approaching a crucial resistance trendline within a well-defined downward sloping channel. Price currently tests mid-channel and historical supply zones, with multiple Leola Lens SignalPro yellow caution labels plotted—historically seen before directional reversals.
📌 Structure Highlight
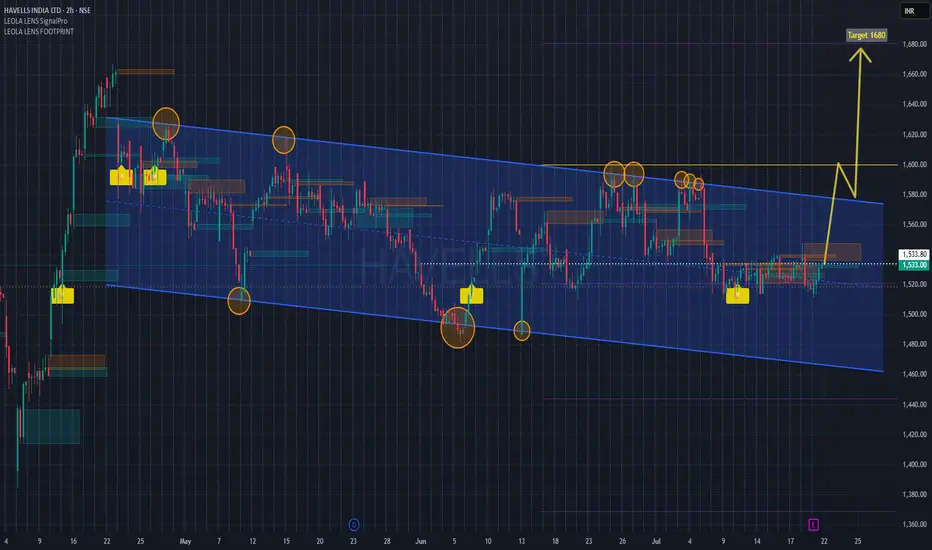
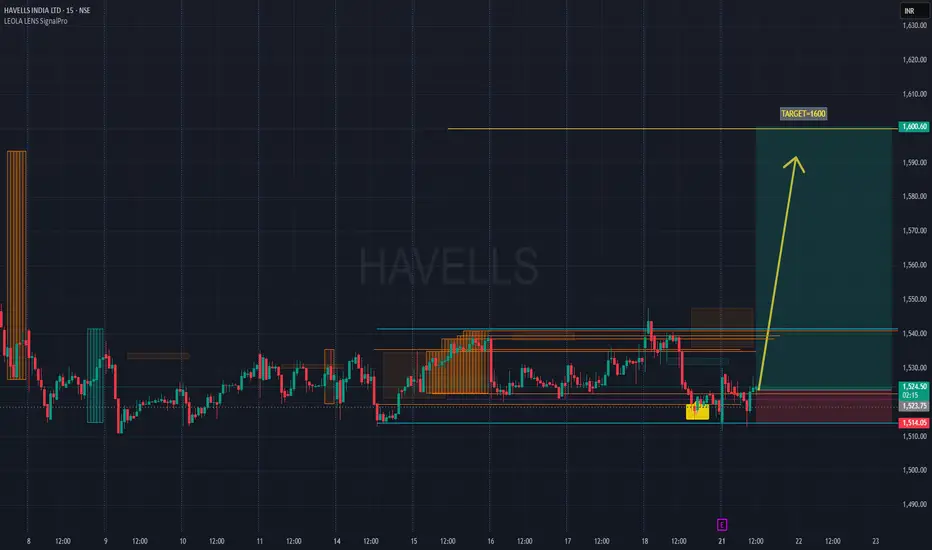
HAVELLS Pre-Result Reversal Watch I Holds for Potential 1600Chart Type: 15-minute | Tool Used: Leola Lens SignalPro
Price action has rebounded from a key liquidity zone (highlighted yellow) with visible accumulation below ₹1,520.
Key Observations:
Price retested prior demand zone (marked by SignalPro with structure and volume signals).
Potential bottom f
Havells India Shows Early Bullish Signs After Strong Support at Topic Statement:
Havells India has corrected but is showing early bullish signals, supported by key technical levels and poised for a breakout from its short-term downtrend.
Key Points:
* The price corrected to the 38.2% Fibonacci retracement level, where it received strong support
* It touched the
See all ideas
Summarizing what the indicators are suggesting.
Neutral
SellBuy
Strong sellStrong buy
Strong sellSellNeutralBuyStrong buy
Neutral
SellBuy
Strong sellStrong buy
Strong sellSellNeutralBuyStrong buy
Neutral
SellBuy
Strong sellStrong buy
Strong sellSellNeutralBuyStrong buy
An aggregate view of professional's ratings.
Neutral
SellBuy
Strong sellStrong buy
Strong sellSellNeutralBuyStrong buy
Neutral
SellBuy
Strong sellStrong buy
Strong sellSellNeutralBuyStrong buy
Neutral
SellBuy
Strong sellStrong buy
Strong sellSellNeutralBuyStrong buy
Displays a symbol's price movements over previous years to identify recurring trends.
AMEG
Amundi MSCI Emerging Markets SRI Climate Paris Aligned -UCITS ETF DR- DistributionWeight
0.46%
Market value
11.76 M
USD
MSDU
Amundi MSCI Emerging Markets SRI Climate Paris Aligned UCITS ETF DR (D)Weight
0.46%
Market value
11.76 M
USD
AMEI
Amundi MSCI Emerging Markets SRI Climate Paris Aligned UCITS ETF DR C- CapitalisationWeight
0.46%
Market value
11.76 M
USD
Explore more ETFs
Curated watchlists where HAVELLS is featured.

Frequently Asked Questions
The current price of HAVELLS is 1,488.10 INR — it has increased by 0.20% in the past 24 hours. Watch Havells India Limited stock price performance more closely on the chart.
Depending on the exchange, the stock ticker may vary. For instance, on NSE exchange Havells India Limited stocks are traded under the ticker HAVELLS.
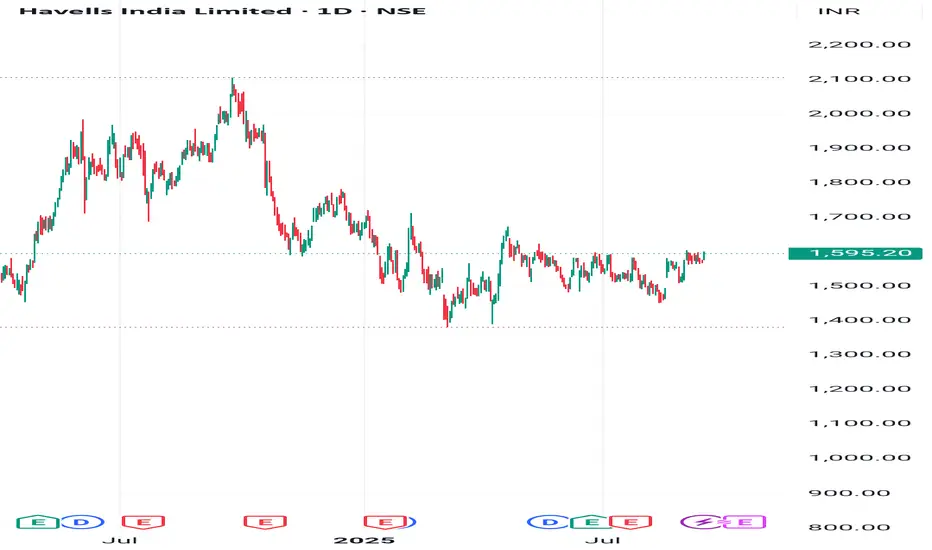
HAVELLS stock has fallen by −2.99% compared to the previous week, the month change is a −5.94% fall, over the last year Havells India Limited has showed a −24.04% decrease.
We've gathered analysts' opinions on Havells India Limited future price: according to them, HAVELLS price has a max estimate of 1,910.00 INR and a min estimate of 1,219.00 INR. Watch HAVELLS chart and read a more detailed Havells India Limited stock forecast: see what analysts think of Havells India Limited and suggest that you do with its stocks.
HAVELLS reached its all-time high on Sep 23, 2024 with the price of 2,106.00 INR, and its all-time low was 1.20 INR and was reached on Mar 25, 2003. View more price dynamics on HAVELLS chart.
See other stocks reaching their highest and lowest prices.
See other stocks reaching their highest and lowest prices.
HAVELLS stock is 1.32% volatile and has beta coefficient of 1.23. Track Havells India Limited stock price on the chart and check out the list of the most volatile stocks — is Havells India Limited there?
Today Havells India Limited has the market capitalization of 933.82 B, it has decreased by −2.67% over the last week.
Yes, you can track Havells India Limited financials in yearly and quarterly reports right on TradingView.
Havells India Limited is going to release the next earnings report on Oct 17, 2025. Keep track of upcoming events with our Earnings Calendar.
HAVELLS earnings for the last quarter are 5.62 INR per share, whereas the estimation was 6.67 INR resulting in a −15.74% surprise. The estimated earnings for the next quarter are 5.01 INR per share. See more details about Havells India Limited earnings.
Havells India Limited revenue for the last quarter amounts to 54.38 B INR, despite the estimated figure of 59.54 B INR. In the next quarter, revenue is expected to reach 48.22 B INR.
HAVELLS net income for the last quarter is 3.48 B INR, while the quarter before that showed 5.18 B INR of net income which accounts for −32.85% change. Track more Havells India Limited financial stats to get the full picture.
Havells India Limited dividend yield was 0.65% in 2024, and payout ratio reached 42.58%. The year before the numbers were 0.59% and 44.38% correspondingly. See high-dividend stocks and find more opportunities for your portfolio.
As of Oct 5, 2025, the company has 36.38 K employees. See our rating of the largest employees — is Havells India Limited on this list?
EBITDA measures a company's operating performance, its growth signifies an improvement in the efficiency of a company. Havells India Limited EBITDA is 21.18 B INR, and current EBITDA margin is 10.06%. See more stats in Havells India Limited financial statements.
Like other stocks, HAVELLS shares are traded on stock exchanges, e.g. Nasdaq, Nyse, Euronext, and the easiest way to buy them is through an online stock broker. To do this, you need to open an account and follow a broker's procedures, then start trading. You can trade Havells India Limited stock right from TradingView charts — choose your broker and connect to your account.
Investing in stocks requires a comprehensive research: you should carefully study all the available data, e.g. company's financials, related news, and its technical analysis. So Havells India Limited technincal analysis shows the sell today, and its 1 week rating is sell. Since market conditions are prone to changes, it's worth looking a bit further into the future — according to the 1 month rating Havells India Limited stock shows the neutral signal. See more of Havells India Limited technicals for a more comprehensive analysis.
If you're still not sure, try looking for inspiration in our curated watchlists.
If you're still not sure, try looking for inspiration in our curated watchlists.