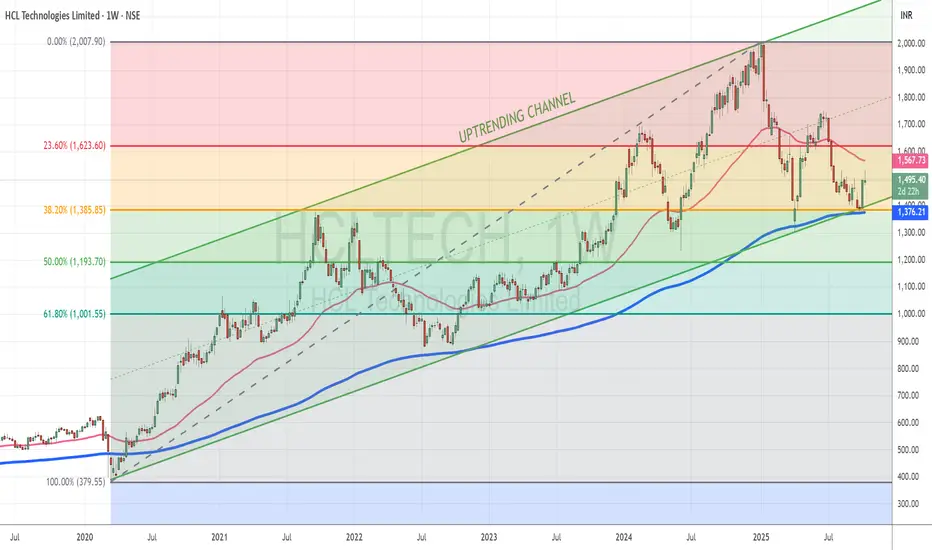
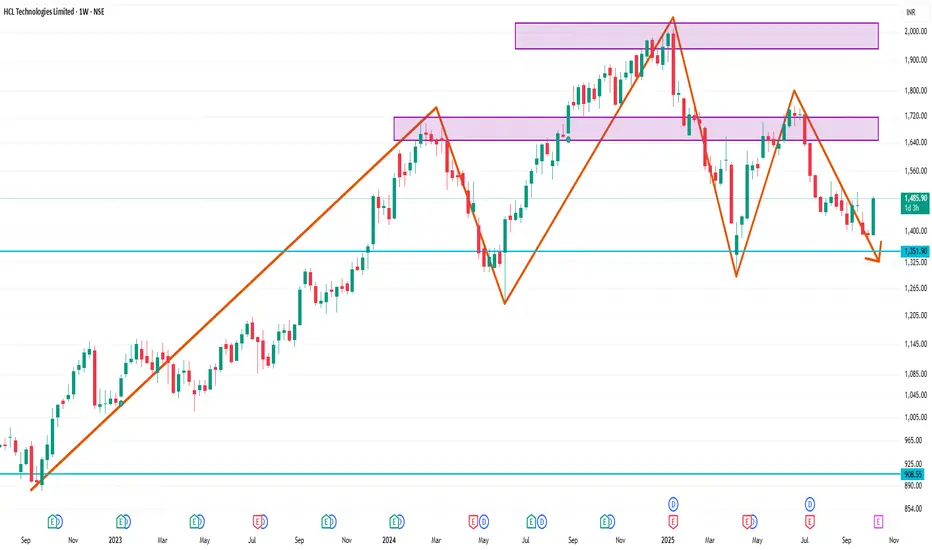
HCLTech shows signs of reversal after global-policy-driven correTopic Statement:
HCLTech, like other IT peers, has been dragged down by global economic policies but now shows early signs of recovery from key support levels.
Key Points:
1. The stock corrected down to the 38.2% Fibonacci retracement level at 1385, where it found strong support
2. Price reversed a
Next report date
—
Report period
—
EPS estimate
—
Revenue estimate
—
62.70 INR
173.90 B INR
1.17 T INR
1.05 B
About HCL Technologies Limited
Sector
Industry
CEO
Chinnaswamy Vijayakumar
Website
Headquarters
Noida
Founded
1991
ISIN
INE860A01027
FIGI
BBG000C68WP6
HCL Technologies Ltd. Is a tech company, which engages in computer programming, consultancy, and related activities. It operates through the following segments: Information Technology and Business Services (ITBS); Engineering and Research and Development Services (ERS); and Products and Platforms segments. The Information Technolgy and Business Services segments offers technology architecture for businesses. The Engineering and Research and Development Services segment develops digital solutions for different engineering sectors. The Products and Platforms segments offer the HCLSoftware for domain-specific niche sectors. The company was founded by Shiv Nadar on November 12, 1991 and is headquartered in Noida, India.
Related stocks
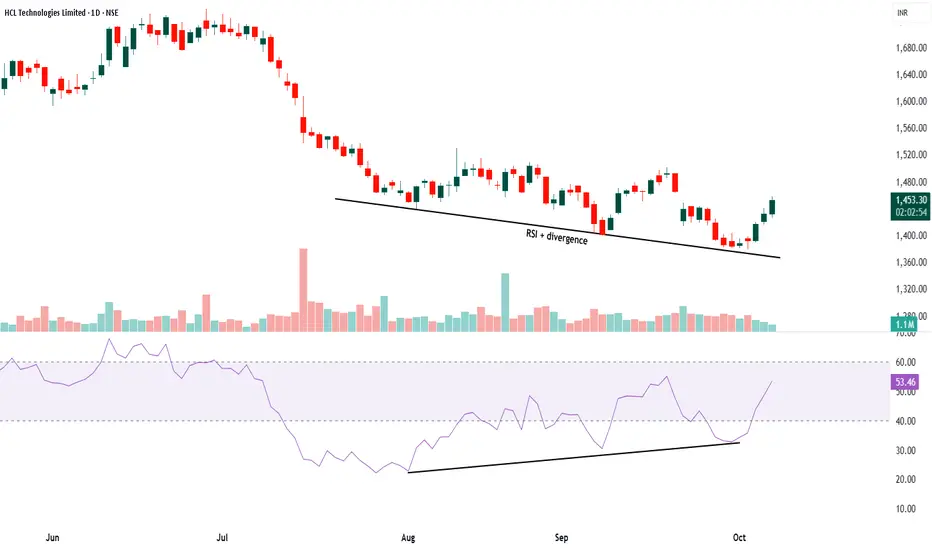
HCL TECH - RSI positive divergenceRSI positive divergence is a powerful technical analysis signal that indicates a potential trend reversal from bearish to bullish. Here's a simple step-by-step explanation for your community members:
Understand RSI: The Relative Strength Index (RSI) measures the speed and change of price movements
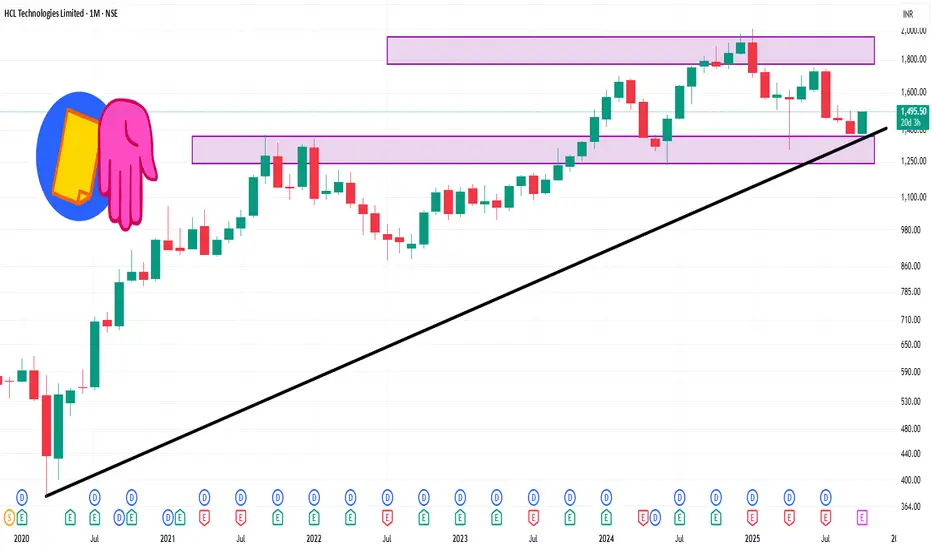
HCLTECH 1 Month Time Frame 📈 1-Month Performance Overview
Current Price: ₹1,495.50
1-Month Change: +4.19%
52-Week Range: ₹1,302.75 – ₹2,012.20
Market Capitalization: ₹4,05,612 crore
P/E Ratio (TTM): 23.88
Dividend Yield: 4.02%
Over the past month, HCL Technologies has shown a steady upward trend, outperforming the Nifty IT In
Risk Management vs Position Sizing in Option Trading1. Introduction to Risk Management in Option Trading
Risk management refers to the strategies and techniques traders use to minimize potential losses and protect their capital. In simple terms, it’s the process of deciding how much risk you are willing to take on each trade and how to respond when
HCLTECH 1 Week Time Frame📈 1-Week Performance Overview
Current Price: ₹1,480.00 (as of October 9, 2025)
Weekly Gain: Approximately 6.51%
📊 Recent Trading Highlights
October 8, 2025: Closed at ₹1,452.85, up 1.34% from the previous day, outperforming the BSE SENSEX Index, which declined by 0.19%.
October 7, 2025: Closed at ₹
HCLTECH 1D Time frameOpening Price: ₹1,387.40
Closing Price: ₹1,387.40
Day Range: ₹1,383.10 – ₹1,395.00
Previous Close: ₹1,387.40
📉 Trend Analysis
Short-Term Trend: Bearish — The stock is trading below key moving averages, confirming the bearish trend.
Medium-Term Trend: Neutral — The stock is in a consolidation p
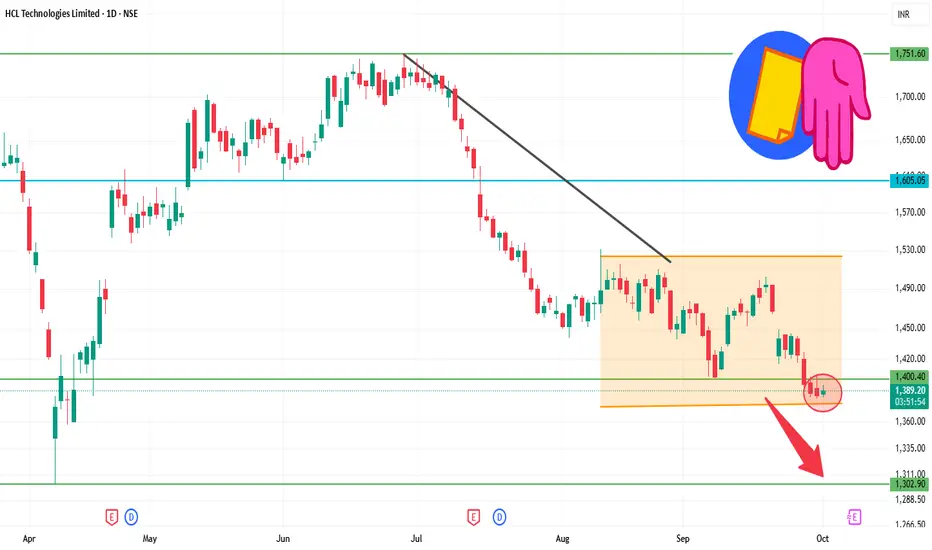
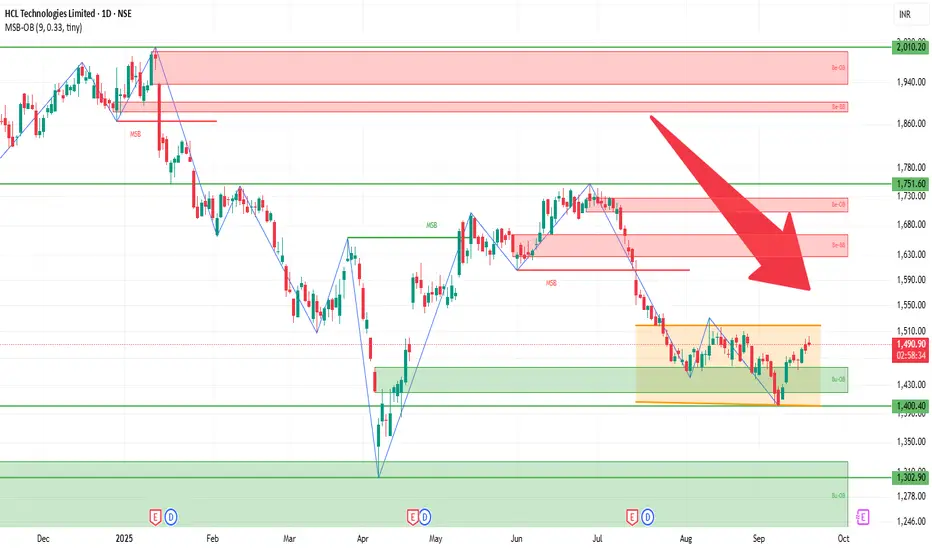
HCL Technologies.HCL Technologies is currently consolidating after a sharp correction and has formed a base near the buy zone of 1414–1301. The stock has broken out of its downtrend line and is showing early signs of reversal.
View: Bullish reversal in progress. Accumulation in the buy zone with strict SL offers fa

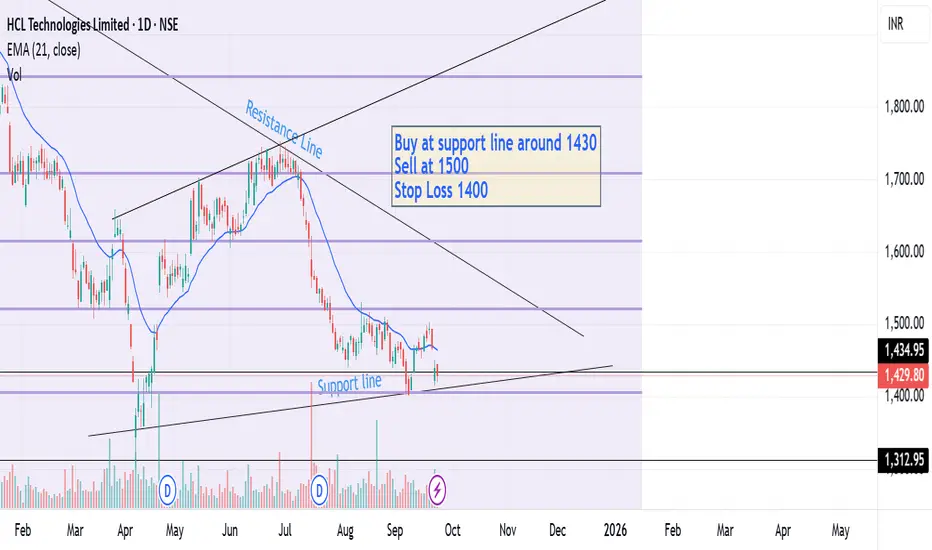
Stock near Support. Definite BuyBuy and SL and Target prices mentioned. This is a conservatinve trade.
Fib retracement and support resistance lines are drawn. Also in Weekly timeframe the price is away from EMA21 line below. it also indicates the price wiull move up.
HCLTECH 1D Time frame📊 Current Overview
Price is trading near ₹1,460 – ₹1,470 range.
Trend on the daily chart is showing weakness.
Stock is trading below most key moving averages (50-day, 100-day, 200-day).
🔍 Support & Resistance
Immediate Support: ₹1,450
Next Support: ₹1,430 – ₹1,420
Immediate Resistance: ₹1,470
HCLTECH 1D Time frameCurrent Picture
Share price is ~ ₹1,499-₹1,505.
Recent momentum has been upward; the stock is trading above most moving averages—short-, medium-, and long-term.
Indicators are generally favoring continuation of the uptrend.
⚙️ Indicators / Momentum
Many oscillators (RSI, MACD, CCI etc.) are in
See all ideas
Summarizing what the indicators are suggesting.
Neutral
SellBuy
Strong sellStrong buy
Strong sellSellNeutralBuyStrong buy
Neutral
SellBuy
Strong sellStrong buy
Strong sellSellNeutralBuyStrong buy
Neutral
SellBuy
Strong sellStrong buy
Strong sellSellNeutralBuyStrong buy
An aggregate view of professional's ratings.
Neutral
SellBuy
Strong sellStrong buy
Strong sellSellNeutralBuyStrong buy
Neutral
SellBuy
Strong sellStrong buy
Strong sellSellNeutralBuyStrong buy
Neutral
SellBuy
Strong sellStrong buy
Strong sellSellNeutralBuyStrong buy
Displays a symbol's price movements over previous years to identify recurring trends.
Curated watchlists where HCLTECH is featured.

Indian stocks: Racing ahead
46 No. of Symbols
See all sparks
Frequently Asked Questions
The current price of HCLTECH is 1,497.00 INR — it has increased by 1.29% in the past 24 hours. Watch HCL Technologies Limited stock price performance more closely on the chart.
Depending on the exchange, the stock ticker may vary. For instance, on NSE exchange HCL Technologies Limited stocks are traded under the ticker HCLTECH.
HCLTECH stock has risen by 4.25% compared to the previous week, the month change is a 3.49% rise, over the last year HCL Technologies Limited has showed a −19.94% decrease.
We've gathered analysts' opinions on HCL Technologies Limited future price: according to them, HCLTECH price has a max estimate of 1,980.00 INR and a min estimate of 1,381.00 INR. Watch HCLTECH chart and read a more detailed HCL Technologies Limited stock forecast: see what analysts think of HCL Technologies Limited and suggest that you do with its stocks.
HCLTECH reached its all-time high on Jan 13, 2025 with the price of 2,012.20 INR, and its all-time low was 12.90 INR and was reached on Sep 27, 2001. View more price dynamics on HCLTECH chart.
See other stocks reaching their highest and lowest prices.
See other stocks reaching their highest and lowest prices.
HCLTECH stock is 2.42% volatile and has beta coefficient of 0.97. Track HCL Technologies Limited stock price on the chart and check out the list of the most volatile stocks — is HCL Technologies Limited there?
Today HCL Technologies Limited has the market capitalization of 4.06 T, it has increased by 2.29% over the last week.
Yes, you can track HCL Technologies Limited financials in yearly and quarterly reports right on TradingView.
HCL Technologies Limited is going to release the next earnings report on Jan 9, 2026. Keep track of upcoming events with our Earnings Calendar.
HCLTECH earnings for the last quarter are 15.61 INR per share, whereas the estimation was 15.66 INR resulting in a −0.32% surprise. The estimated earnings for the next quarter are 17.43 INR per share. See more details about HCL Technologies Limited earnings.
HCL Technologies Limited revenue for the last quarter amounts to 319.68 B INR, despite the estimated figure of 315.74 B INR. In the next quarter, revenue is expected to reach 325.79 B INR.
HCLTECH net income for the last quarter is 42.35 B INR, while the quarter before that showed 38.43 B INR of net income which accounts for 10.20% change. Track more HCL Technologies Limited financial stats to get the full picture.
HCL Technologies Limited dividend yield was 3.39% in 2024, and payout ratio reached 84.17%. The year before the numbers were 3.37% and 89.67% correspondingly. See high-dividend stocks and find more opportunities for your portfolio.
As of Oct 17, 2025, the company has 234.5 K employees. See our rating of the largest employees — is HCL Technologies Limited on this list?
EBITDA measures a company's operating performance, its growth signifies an improvement in the efficiency of a company. HCL Technologies Limited EBITDA is 259.22 B INR, and current EBITDA margin is 22.03%. See more stats in HCL Technologies Limited financial statements.
Like other stocks, HCLTECH shares are traded on stock exchanges, e.g. Nasdaq, Nyse, Euronext, and the easiest way to buy them is through an online stock broker. To do this, you need to open an account and follow a broker's procedures, then start trading. You can trade HCL Technologies Limited stock right from TradingView charts — choose your broker and connect to your account.
Investing in stocks requires a comprehensive research: you should carefully study all the available data, e.g. company's financials, related news, and its technical analysis. So HCL Technologies Limited technincal analysis shows the neutral today, and its 1 week rating is sell. Since market conditions are prone to changes, it's worth looking a bit further into the future — according to the 1 month rating HCL Technologies Limited stock shows the buy signal. See more of HCL Technologies Limited technicals for a more comprehensive analysis.
If you're still not sure, try looking for inspiration in our curated watchlists.
If you're still not sure, try looking for inspiration in our curated watchlists.