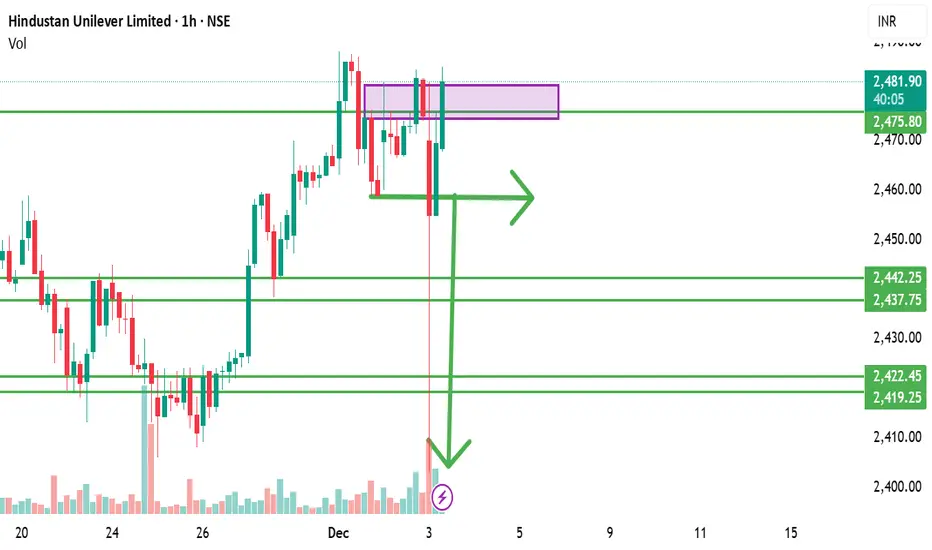
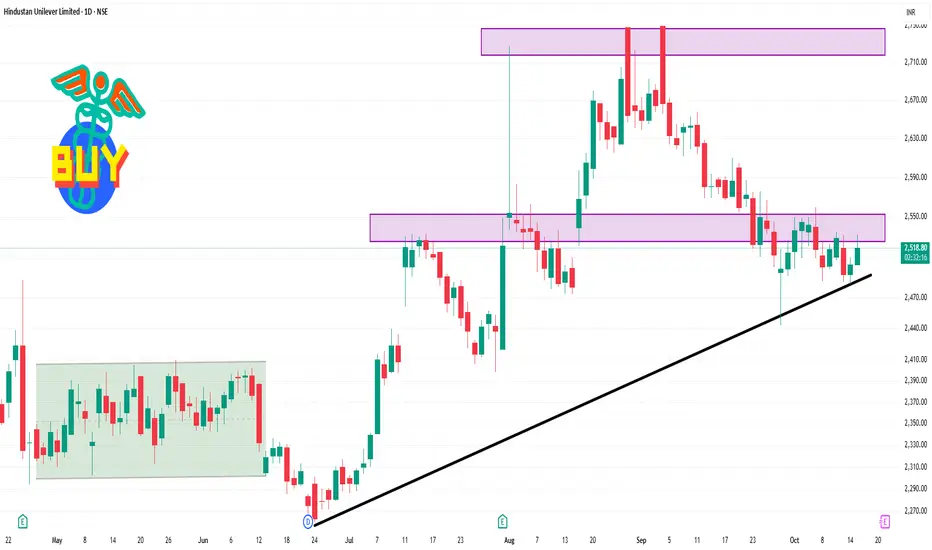
HINDUNILVR – BUY @ CMPHindustan Unilever has taken out all the stop-losses below the recent swing lows and immediately bounced back above ₹2476, showing a clear liquidity sweep + bullish recovery.
Market swept all SLs below the support zone (liquidity grab)
Quick recovery and trading back above ₹2476
Structure turning
Next report date
—
Report period
—
EPS estimate
—
Revenue estimate
—
46.35 INR
106.49 B INR
628.81 B INR
886.60 M
About Hindustan Unilever Limited
Sector
Industry
CEO
Priya Sukumar Nair
Website
Headquarters
Mumbai
Founded
1956
ISIN
INE030A01027
FIGI
BBG000CSMHN7
Hindustan Unilever Limited is engaged in fast-moving consumer goods business comprising home and personal care, foods and refreshments. The Company's segments are Soaps and Detergents, which includes soaps, detergent bars, detergent powders, detergent liquids and scourers; Personal Products, which includes products in categories of oral care, skin care (excluding soaps), hair care, deodorants, talcum powder, color cosmetics and salon services; Beverages, which includes tea and coffee; Packaged Foods, which includes branded staples (atta, salt and bread), culinary products (tomato-based products, fruit-based products and soups) and frozen desserts, and Others that includes exports, chemicals, water business and infant care products. The Others segment also includes export sale of marine and leather products. Its brands include Lux, Surf excel, Rin, Wheel, Fair & Lovely, Pond's, Vaseline, Lakme, Dove, Clinic Plus, Sunsilk, Axe, Brooke Bond, Bru, Knorr, Kissan, Kwality Wall's and Pureit.
Related stocks
Part 1 Support and Resistance Understanding the Foundation of Option Profits
Before diving into strategies, two basic forces determine profit in options:
A. Price Movement of the Underlying
If the underlying asset (stock, index, commodity) moves in the direction you expect, your option gains value.
Calls gain when price goes

Part 1 Intraday Master Class Risks in Options Trading
Although options offer leverage, they come with risks:
1. Time Decay (Theta Loss)
Options lose value as expiry approaches.
2. Volatility Crush
Premiums drop sharply when IV falls.
3. Unlimited Loss for Sellers
Selling naked calls/puts is extremely risky.
4. Liquidity

Premium Chart Pattern Knowledge Psychological Foundations of Premium Patterns
Premium patterns are effective because they exploit:
1. Retail Traders’ Fear
People exit during fake breakouts.
2. Greed
People enter late into a move.
3. Manipulation
Institutions trigger false moves to collect liquidity.
4. Volume Behavior
Sma

Part 2 Candle Stick PatternRisks in Option Trading
While options provide great opportunities, they are not without risk:
Leverage Risk: High leverage can magnify both gains and losses.
Time Decay: Options lose value as expiration approaches, especially if they are out-of-the-money.
Complexity: Advanced strategies can be c

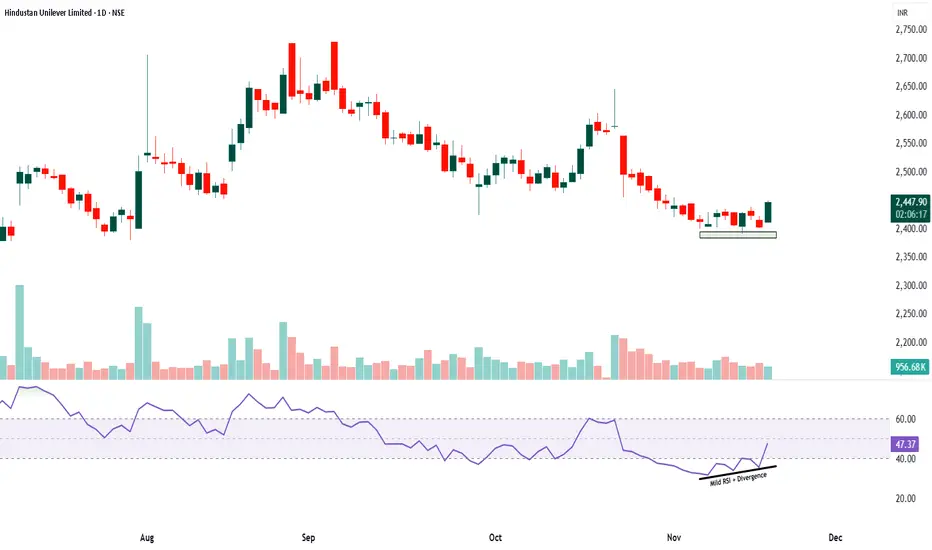
HINDUNILVR - longThe chart shows a mild RSI divergence where the price made a lower low near the 2400 zone while RSI formed a higher low, indicating that the selling momentum is reducing even though the price slipped slightly. This zone also aligns with a strong weekly support area where the stock has earlier taken
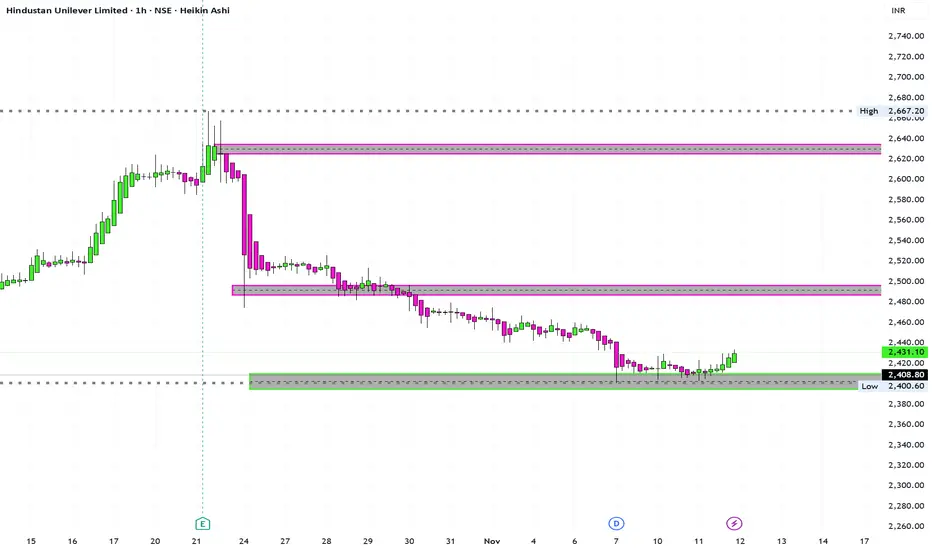
Hindustan Unilever Limited – Possible Reversal from Support Zone🟢 Hindustan Unilever Limited – Possible Reversal from Support Zone
Timeframe: 1 Hour (Heikin Ashi)
Structure: Price approaching demand zone
🔍 Analysis:
The stock has been in a consistent downtrend and is now testing a strong support zone near ₹2400–₹2410.
Multiple rejections from this zone indic
HINDUNILVR – Bulls Resting, Bears Watching💹 Hindustan Unilever Ltd (NSE: HINDUNILVR)
Sector: FMCG | CMP: ₹2,610.80 | View: Neutral-to-Bullish Zone Reaction Setup
Key Levels:
Resistance: 2618/2641/2657
Support: 2578/2562/2539
STWP Trade Analysis:
A Retested Demand zone: 2509.20 – 2482.30
Stock has moved up almost 4% in the last 4 days.
Th
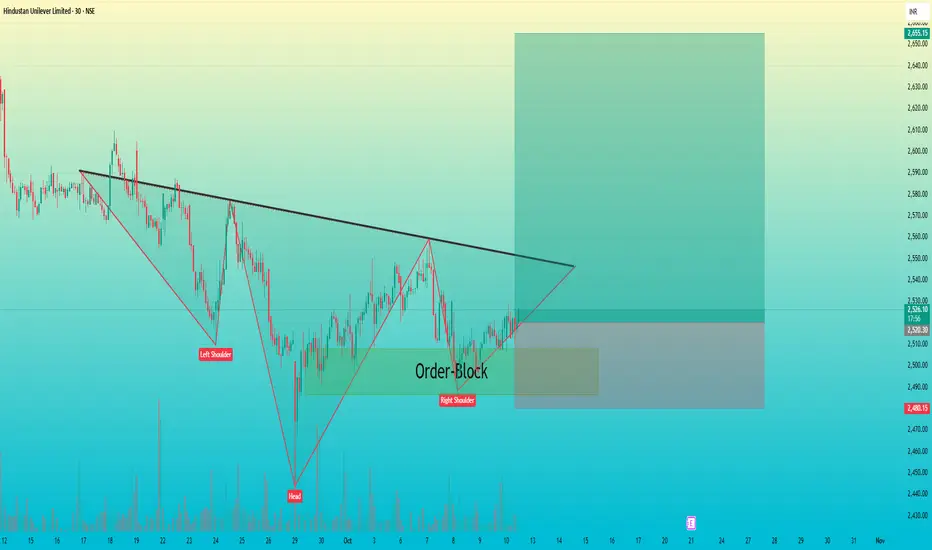
HINDUNILVR : Inverse Head & Shoulders + Order-Block setup Technical Analysis: Hindustan Unilever Ltd
Timeframe: 30-Minute
Pattern: Inverse Head & Shoulders with Order Block Confluence
Pattern Insight
The market has created a clear inverse head and shoulders structure —
showing potential trend reversal from a short-term downtrend to an uptrend.
The
HINDUNILVR 1 Day Time Frame 📊 Intraday Price Range
Day Range: ₹2,502.60 – ₹2,531.80
VWAP (Volume-Weighted Average Price): ₹2,521.48
🔰 Pivot & Support/Resistance Levels
Standard Pivot: ₹2,513.57
Resistance (R1): ₹2,524.83
Resistance (R2): ₹2,540.47
Support (S1): ₹2,497.93
Support (S2): ₹2,486.67
🔁 Technical Outl
See all ideas
Summarizing what the indicators are suggesting.
Neutral
SellBuy
Strong sellStrong buy
Strong sellSellNeutralBuyStrong buy
Neutral
SellBuy
Strong sellStrong buy
Strong sellSellNeutralBuyStrong buy
Neutral
SellBuy
Strong sellStrong buy
Strong sellSellNeutralBuyStrong buy
An aggregate view of professional's ratings.
Neutral
SellBuy
Strong sellStrong buy
Strong sellSellNeutralBuyStrong buy
Neutral
SellBuy
Strong sellStrong buy
Strong sellSellNeutralBuyStrong buy
Neutral
SellBuy
Strong sellStrong buy
Strong sellSellNeutralBuyStrong buy
Displays a symbol's price movements over previous years to identify recurring trends.
Curated watchlists where HINDUNILVR is featured.

Indian stocks: Racing ahead
46 No. of Symbols
See all sparks
Frequently Asked Questions
The current price of HINDUNILVR is 2,306.50 INR — it has decreased by −1.05% in the past 24 hours. Watch Hindustan Unilever Limited stock price performance more closely on the chart.
Depending on the exchange, the stock ticker may vary. For instance, on NSE exchange Hindustan Unilever Limited stocks are traded under the ticker HINDUNILVR.
HINDUNILVR stock has fallen by −6.19% compared to the previous week, the month change is a −4.26% fall, over the last year Hindustan Unilever Limited has showed a −6.43% decrease.
We've gathered analysts' opinions on Hindustan Unilever Limited future price: according to them, HINDUNILVR price has a max estimate of 3,150.42 INR and a min estimate of 1,935.54 INR. Watch HINDUNILVR chart and read a more detailed Hindustan Unilever Limited stock forecast: see what analysts think of Hindustan Unilever Limited and suggest that you do with its stocks.
HINDUNILVR reached its all-time high on Sep 23, 2024 with the price of 3,035.00 INR, and its all-time low was 61.50 INR and was reached on Jan 5, 1996. View more price dynamics on HINDUNILVR chart.
See other stocks reaching their highest and lowest prices.
See other stocks reaching their highest and lowest prices.
HINDUNILVR stock is 1.41% volatile and has beta coefficient of 0.36. Track Hindustan Unilever Limited stock price on the chart and check out the list of the most volatile stocks — is Hindustan Unilever Limited there?
Today Hindustan Unilever Limited has the market capitalization of 5.44 T, it has increased by 1.85% over the last week.
Yes, you can track Hindustan Unilever Limited financials in yearly and quarterly reports right on TradingView.
Hindustan Unilever Limited is going to release the next earnings report on Feb 5, 2026. Keep track of upcoming events with our Earnings Calendar.
HINDUNILVR earnings for the last quarter are 11.27 INR per share, whereas the estimation was 10.44 INR resulting in a 7.95% surprise. The estimated earnings for the next quarter are 11.19 INR per share. See more details about Hindustan Unilever Limited earnings.
Hindustan Unilever Limited revenue for the last quarter amounts to 158.13 B INR, despite the estimated figure of 158.29 B INR. In the next quarter, revenue is expected to reach 166.46 B INR.
HINDUNILVR net income for the last quarter is 26.85 B INR, while the quarter before that showed 27.56 B INR of net income which accounts for −2.58% change. Track more Hindustan Unilever Limited financial stats to get the full picture.
Hindustan Unilever Limited dividend yield was 1.90% in 2024, and payout ratio reached 94.87%. The year before the numbers were 1.85% and 96.02% correspondingly. See high-dividend stocks and find more opportunities for your portfolio.
As of Dec 9, 2025, the company has 26.67 K employees. See our rating of the largest employees — is Hindustan Unilever Limited on this list?
EBITDA measures a company's operating performance, its growth signifies an improvement in the efficiency of a company. Hindustan Unilever Limited EBITDA is 147.61 B INR, and current EBITDA margin is 23.65%. See more stats in Hindustan Unilever Limited financial statements.
Like other stocks, HINDUNILVR shares are traded on stock exchanges, e.g. Nasdaq, Nyse, Euronext, and the easiest way to buy them is through an online stock broker. To do this, you need to open an account and follow a broker's procedures, then start trading. You can trade Hindustan Unilever Limited stock right from TradingView charts — choose your broker and connect to your account.
Investing in stocks requires a comprehensive research: you should carefully study all the available data, e.g. company's financials, related news, and its technical analysis. So Hindustan Unilever Limited technincal analysis shows the sell today, and its 1 week rating is strong sell. Since market conditions are prone to changes, it's worth looking a bit further into the future — according to the 1 month rating Hindustan Unilever Limited stock shows the sell signal. See more of Hindustan Unilever Limited technicals for a more comprehensive analysis.
If you're still not sure, try looking for inspiration in our curated watchlists.
If you're still not sure, try looking for inspiration in our curated watchlists.