HINDUNILVRHINDUNILVR :- formed cup and handle bullish pattern but if he break 2488 level support its go down....
Trade ideas

HINDUNILVR seems little bit negative to meNSE:HINDUNILVR is showing inverted head and shoulder pattern. So there might be some crack in this.

fall - pe buylooking to enter nov 2500 pe around 50
keeping stop and target open for now
more fall expected in closing below 2510-2490
lets c what happens
disclaimer - trade @ own risk

HINDUNILVR looking good on charts-BUYtaking support around the trendline
STOP LOSS-BELOW 2500
TARGET-2850

Hindustan Unilever Cmp 2505 dated 25-10-2022 TRENDLINE BREAKDOWNHindustan Unilever Cmp 2505 dated 25-10-2022
1. Trendline Breakdown below 2500
Sell below 2500 for target 2470-2445-2400 SL 2545
Disclaimer :
I am not a Sebi registered Analyst so please do your own Analysis before taking any action.
The above view is shared just for educational purpose.
By no means shall be responsible for any losses amounting out of it incase if any trades on it.
It is just a view, pls trade at your own risk.

HUL losing 5% in 2 session. What next?Hindustan Unilever has lost 5% in only 2 trading session, taking stock around 2500 figure.
The stock on the daily time frame has broken the 20 DMA and closed just near the support level of 2500.
The support has been tested 4 times and if the support line is broken the stock can plummet to 2450 levels.
Even on the weekly chart analysis, the stock is trading under 20 ema.
3 Point confirmation
1. Close below the 20 DMA (on daily chart).
2. High volume break down.
3. Bearish moving average cross over (on hourly charts).
The stock can be prefered for a sell trade once it start trading below the 2500 level.
Target :- 2450 (200 DMA), 2415
Stop loss :- 2525
Stock option for the next month expiry can be traded in the stock.
Wait for the levels to break down and watch for a price action near the levels before entering the trade.

Hinduniliver HUL
Broke down of Pithfork
Any bounce to 2542 would be used for shorts.
SL above 2600
Target 2446/2388

HINDUSTAN UNILEVER | 2660 - 2700 LOOKS TOUGH ZONEHindustan Unilever approaching towards resistance zone 2660 - 2700 and RR looks good to take short position.
To motivate us, Please like the idea If you agree with the analysis.
Happy Trading!
InvestPro India Team

HINDUSTAN UNILEVERHUL is trying to take support multiple times on the support line, if it breaks the support then it can be considered for Short.

Hindunilver on 1hr timeframe Trading between resistance level and support trendline
Wait for breakout or breakdown then take trade accordingly
10/11/2021 Research Report For Hindusthan UnileverDisclaimer:
I am not SEBI registered person and this is not an investment advice and also please note this is only for education purpose. Also note we can use this research in my own portfolios. So don't influence yourself by this research. Please note before investing according to this educational research, please do own research and also do take advice from your financial adviser. Your any profits and loss are totally your liability. No one is liable for that. Also, please note we will not never compensate your any loss. So before investing any single rupee, please do your own research according to your risk taking capacity and after that do invest and book profits on right time.
Buy at C.M.P (Current Market Price) to Maximum at 2457]
Target 1:- 2480
Target 2:- 2486
Target 3: 2516
Target 4:- 2540

Hindustan Unilever Cmp 2600 dtd 7-10-2022 HAMMER CANDLE @SUPPORTHINDUSTAN UNILEVER CMP 2600 DATED 7-10-2022
SWING TRADE
1. HAMMER CANDLE AT SUPPORT
Buy above 2615 for target 2650-2690-2725 SL 2575
Disclaimer :
I am not a Sebi registered Analyst so please do your own Analysis before taking any action.
The above view is shared just for educational purpose.
By no means shall be responsible for any losses amounting out of it incase if any trades on it.
It is just a view, pls trade at your own risk.

HINDUSTAN UNILVR - Bearish HUL - Formed a rounding Top formation and closed at neckline.
Short below 2525 for the targets given,
Nifty FMCG looks bearish and keep an eye on FMCG stocks

Intraday Short For UnileverHigh Scope for Intraday shorting in Hindustan Unilever. Till the next marked support.
More Intraday stock signals for NSE and BSE segments upcoming daily.

HUL : A bit more patience for bullsHindustan Unilever Limited (HUL) NSE: HINDUNILVR
1. As FMCG Index suggests nearly 3-4% downside space, it would be prudent to wait for some more time in HUL, for a mega move
2. Posting Index chart as well for reference.

Hindustan Unilever Ltd -Daily Time Frame View(3 rd Oct)Current Trend:
1) Top of parallel channel
2) Triple Top
3) Resistance Zone
4) 0.854 level of Fib
Oi too conforms Max call option writes at 2700 and max pain @2700
Target:2530
As per Oi and technical analysis , one can sold call option above 2720

HUL daily Time frameBullish flag pattern with breakout is formed in daily timeframe. One of very few shares which is showing strength in this weak market. Once the rally begin, HUL can give decent returns.

Hindustan Unilever Limited - Down Trend 📊 Script: HINDUNILVR (HINDUSTAN UNILEVER LIMITED)
📊 Nifty50 Stock: YES
📊 Sectoral Index: NIFTY FMCG / NIFTY500 / NIFTY
📊 Sector: Fast Moving Consumer Goods
📊 Industry: Diversified FMCG
Daily Timeframe
Key highlights: 💡⚡
📈 Script is trading at lower band of Bollinger Bands (BB) and giving breakdown of it.
📈 Already Cross-down in MACD .
📈 Already Cross-down in Double Moving Averages.
📈 Current RSI is around 39.
📈 One can go for Swing Trade for short.
⏱️ C.M.P 📑💰- 2528
🟢 Target 🎯🏆 - 2420
⚠️ Stoploss ☠️🚫 - 2582
⚠️ Important: Always maintain your Risk & Reward Ratio.
✅Like and follow to never miss a new idea!✅
Disclaimer: I am not SEBI Registered Advisor. My posts are purely for training and educational purposes.
Eat🍜 Sleep😴 TradingView📈 Repeat 🔁
Happy learning with trading. Cheers!🥂

CnH Formation in HUL#HindUnilever CMP 2686
Seems to be forming CnH and can be taken for 15-25% upside
SL 2600 CLBS

HUL Shooting Star Hindustan uniliver Ltd.
H4 Time-frame
Shooting Star at 2723.75
Low of second candle 2674.65
1:1 Target 2625.55
#shortsell

#HINDUNILVRDescending Low
Impulsive move
Q1 RRG
All timeframes in Momentm
Entered Today during intraday Session

5 Amazing Trades and Index Ideas for 23 September Markets I daily make educational content videos for Financial markets

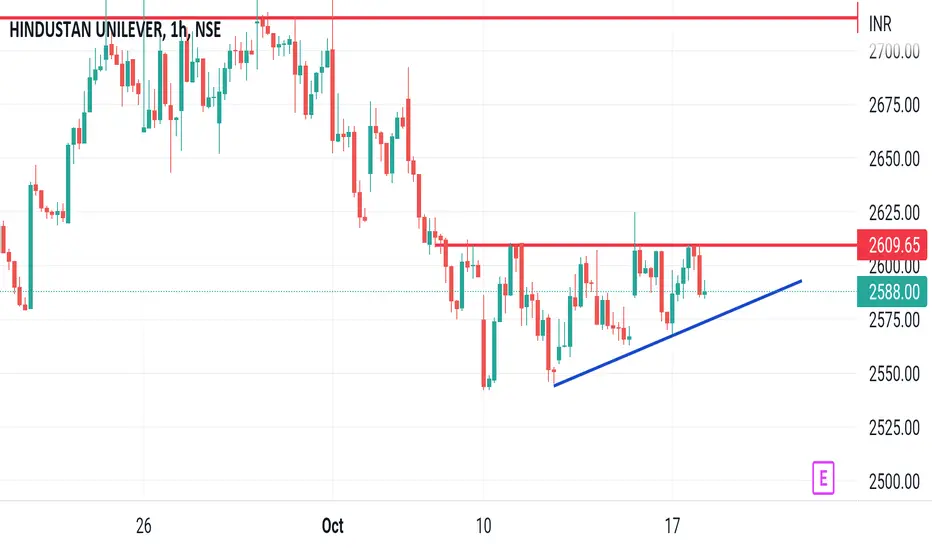
HUL-GIANT IS READY TO RUN~HUL is taking support on ascending trendline.
~The stock is moving in a upper channel.
~Strong RSI
~Available at low risk and high reward.
* Desclaimer- The above information is given for the educational purpose only.Do your own analysis before investing.
LEARN MORE-EARN MORE.
