HSCL | EV‑Battery Tech Catalyst Strong Buy Breakout ⚡
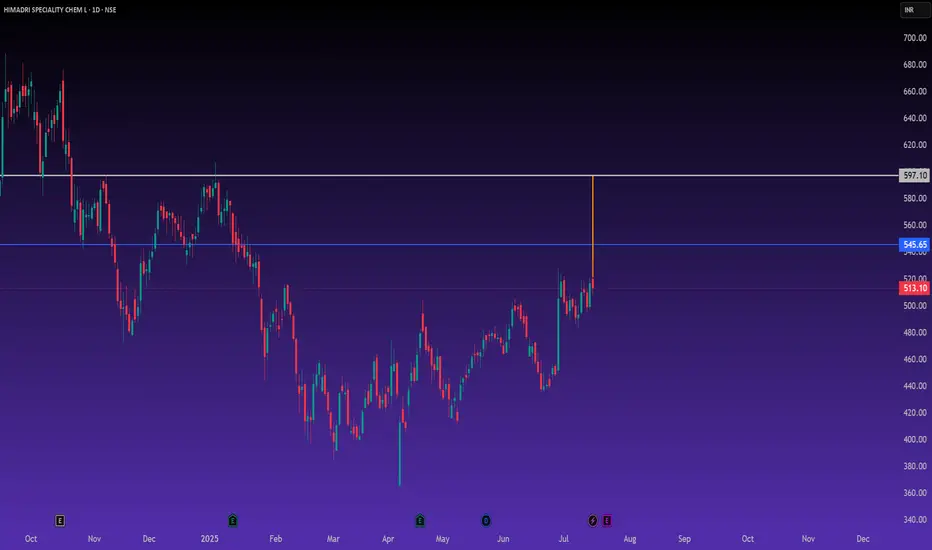
🔹 *Technical:* Strong Buy across Daily/Weekly/Monthly timeframes. RSI ~72, MACD/ADX/CCI/Stoch bullish — breakout above ₹545–550 zone :contentReference {index=24}.
🔹 *Support Levels: * ₹500 pivot; ₹462 (Supertrend/PSAR).
🔹 *Targets: * ₹597–600 next key resistance.
🔹 *Fundamentals:* Q1 EBITDA +28%, Net Profit +46%, EPS ₹3.68. Strong margins: ~19.6% EBITDA, ~12.1% net. ROCE 21.7%, low debt :contentReference {index=25}.
🔹 *Valuation:* P/E ~39× – high, but well‑backed by EPS growth (~23% past year; +27% forecasted) :contentReference {index=26}.
🔹 *Catalyst: * Sicona partnership advancing India’s first SiCx® silicon‑carbon anode plant—battery EV trigger :contentReference {index=27}.
🔹 *Risk:* Valuation premium and possible consolidation after heavy run-up.
📌 *Plan:*
– Long above ₹545–₹550 breakout with volume confirmation
– Initial stop‑loss near ₹500; alternate buffer at ₹462
– Targets: ₹597 → ₹650+ with trend continuation
– Consider adding on dip near support if structure holds
⚠️ Disclaimer
This analysis is for educational and informational purposes only, and not financial, trading, or investment advice. It should not be interpreted as a recommendation to buy, sell, or hold securities. Past performance is no guarantee of future results. Trading and investing involve risks—including potential loss of principal. Always conduct your own due diligence, use proper risk controls, and consult a qualified financial advisor where appropriate.
HSCL trade ideas
BUY TODAY SELL TOMORROW for 5%DON’T HAVE TIME TO MANAGE YOUR TRADES?
- Take BTST trades at 3:25 pm every day
- Try to exit by taking 4-7% profit of each trade
- SL can also be maintained as closing below the low of the breakout candle
Now, why do I prefer BTST over swing trades? The primary reason is that I have observed that 90% of the stocks give most of the movement in just 1-2 days and the rest of the time they either consolidate or fall
Inverted Head and Shoulder Breakout in ASTEC
BUY TODAY SELL TOMORROW for 5%

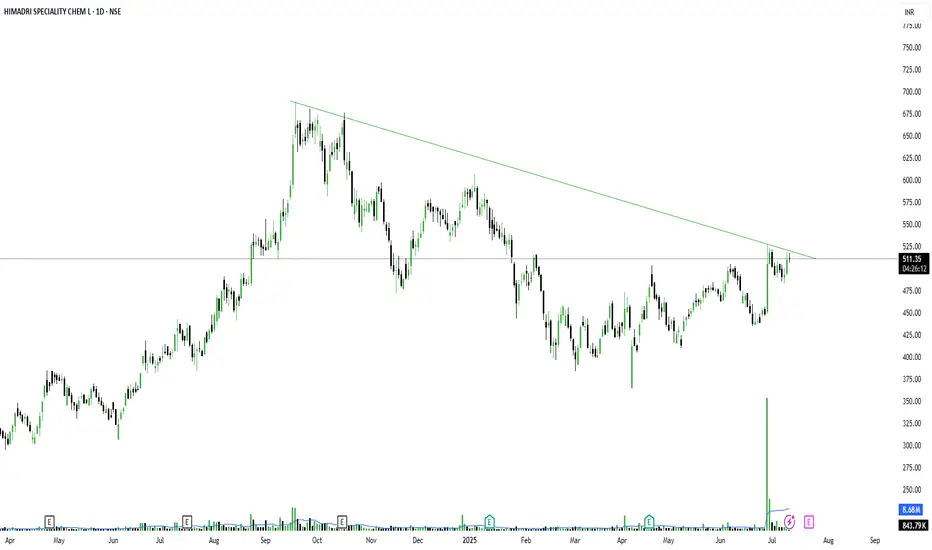
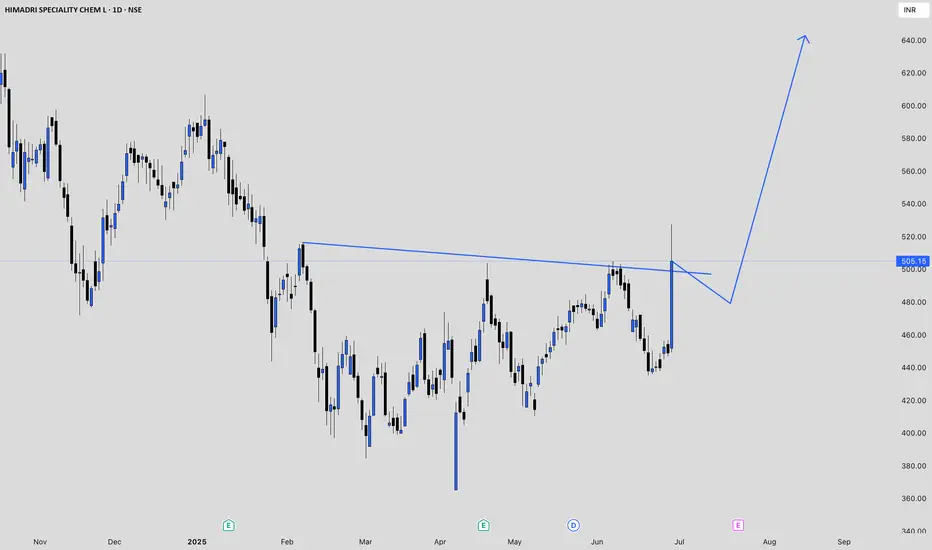
HSCL to Fly Very Sooon!So here's another chart that’s quietly showing signs of strength — NSE:HSCL just kissed its falling trendline drawn from September 2024 highs.
After almost 10 months of lower highs, the stock is now trying to push above the trendline with volume backing it. That giant green candle on June 27 with a volume burst was the sign of Smart Money stepping in. And now it’s consolidating just below the breakout point — classic pre-breakout structure.
This is what we call a volatility contraction near resistance, where price tightens and sets up for an impulsive move. Earnings season is around the corner, and this might just be forming its Earning Pivot.
Don't rush. But if price takes out that 525–530 zone cleanly with volume, it's ready to fly.
#Entry above: 530
#Stoploss: 498
#Target 1: 565
#Target 2: 598
#Extended: 630 (if volume sustains above 600 zone)
Be ready but not greedy.
Let confirmation guide your move. No front running.
Also — this is a stock with explosive history, so manage risk wisely.
Avoid impulse. Trade plans, not predictions.
Have a focused and profitable day ahead.
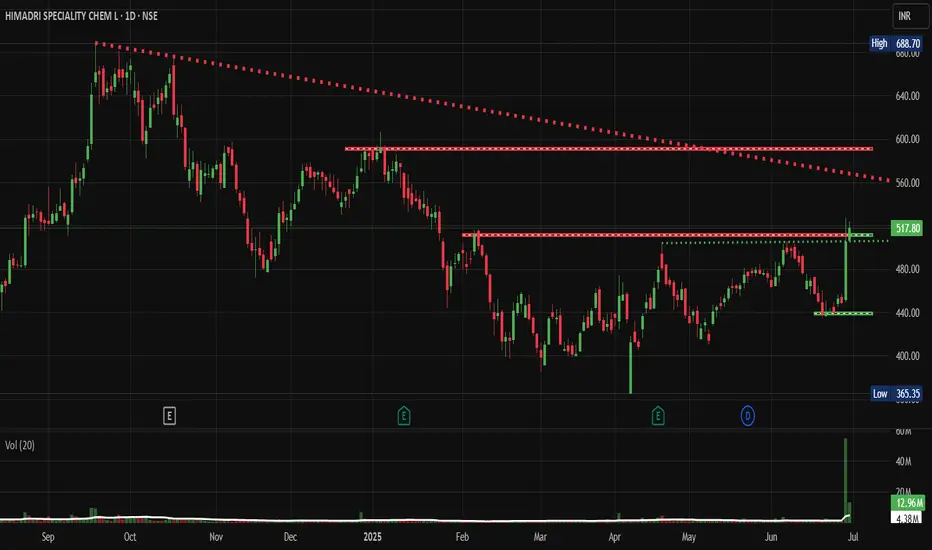
HSCL: A Classic Breakout Story in the MakingNSE:HSCL : A Classic Breakout Story in the Making
Price Action Analysis:
- Stock has formed a strong uptrend from September 2024 lows around 365 levels
- Current price of 517.80 represents a significant +41% move from the base
- Recent breakout above the 500 resistance level with strong volume confirmation
- Price action shows a classic accumulation pattern followed by a markup phase
Volume Spread Analysis:
- Significant volume spike visible in recent sessions (12.96M vs average 4.38M)
- Volume confirmation during breakout above 500 levels
- Accumulation pattern evident with higher volume on up days
- Volume trend supports the bullish price action
Base Formation & Key Levels:
- Primary Base: Formed between 400-520 levels from December 2024 to May 2025
- Secondary Base: 440-480 consolidation zone during March-April 2025
- Base Duration: Approximately 6 months of sideways consolidation
- Base Characteristics: Multiple retests of support levels with decreasing volatility
Key Support & Resistance Levels:
- Immediate Support: 480-500 zone (previous resistance turned support)
- Strong Support: 440-460 zone (multiple bounce levels)
- Major Support: 400 psychological level
- Immediate Resistance: 520-530 zone
- Next Resistance: 580-600 zone (measured move target)
- All-time High Resistance: 688.70
Technical Chart Patterns:
- Cup and Handle Pattern: Visible from October 2024 to June 2025
- Ascending Triangle: Formed during the consolidation phase
- Bullish Flag: Recent consolidation before the breakout
- Higher Highs and Higher Lows: Established uptrend structure
Trade Setup & Strategy:
Entry Strategy:
- Primary Entry: 515-520 on any pullback to the breakout zone
- Aggressive Entry: Current levels around 517-518
- Conservative Entry: Wait for retest of the 500 support level
- Scale-in Approach: 50% at 515, 30% at 505, 20% at 495
Exit Strategy:
- Target 1: 560-570 (Risk-Reward 1:2)
- Target 2: 600-620 (Risk-Reward 1:3)
- Target 3: 650-680 (Risk-Reward 1:4)
- Trailing Stop: Use 480 as a trailing stop once Target 1 is achieved
Risk Management:
- Stop Loss: 475-480 (below breakout support)
- Position Size: Maximum 2-3% of portfolio
- Risk per Trade: Not more than 1% of total capital
- Time Stop: Exit if no progress in 3-4 weeks
Position Sizing Guidelines:
- Conservative Investor: 1-1.5% portfolio allocation
- Moderate Risk: 2-2.5% portfolio allocation
- Aggressive Trader: 3-4% portfolio allocation (with tight stops)
- Swing Trading: 2% with wider stops at 460 levels
Fundamental & Sectoral Backdrop:
Company Overview:
- NSE:HSCL is a leading manufacturer of coal tar pitch and advanced carbon materials
- Key products include coal tar pitch, carbon black feedstock, and speciality carbons
- Strong presence in aluminium, graphite electrode, and speciality chemical sectors
Sectoral Dynamics:
- The speciality chemicals sector is showing strong growth momentum
- Increased demand from the aluminium and steel industries
- The government focus on Make in India and import substitution
- Rising demand for advanced materials in electric vehicles and renewable energy
Fundamental Catalysts:
- Capacity expansion plans and new product launches
- Strong demand from end-user industries
- Improved margin profile due to product mix optimization
- Debt reduction and improved financial metrics
- ESG initiatives and sustainable product development
Market Conditions:
- Overall market sentiment is positive for chemical stocks
- Sectoral rotation favours speciality chemicals
- Export opportunities in global markets
- Raw material cost stabilization supporting margins
Risk Factors:
Technical Risks:
- Failure to sustain above 500 levels could lead to a retest of the 440 support level
- High volatility is expected given the breakout nature
- Overbought conditions in the short term may cause profit booking
Fundamental Risks:
- Raw material price volatility (coal tar and petroleum products)
- Environmental regulations affecting production
- Competition from global players
- Economic slowdown affecting end-user demand
- Currency fluctuation impact on exports/imports
My Take:
My analysis suggests a positive technical setup with strong breakout potential, supported by favourable sectoral trends and improving fundamentals. However, proper risk management and position sizing remain crucial for successful execution.
Keep in the Watchlist.
NO RECO. For Buy/Sell.
📌Thank you for exploring my idea! I hope you found it valuable.
🙏FOLLOW for more
👍BOOST if you found it useful.
✍️COMMENT below with your views.
Meanwhile, check out my other stock ideas on the right side until this trade is activated. I would love your feedback.
Disclaimer: "I am not a SEBI REGISTERED RESEARCH ANALYST AND INVESTMENT ADVISER."
This analysis is intended solely for informational and educational purposes and should not be interpreted as financial advice. It is advisable to consult a qualified financial advisor or conduct thorough research before making investment decisions.
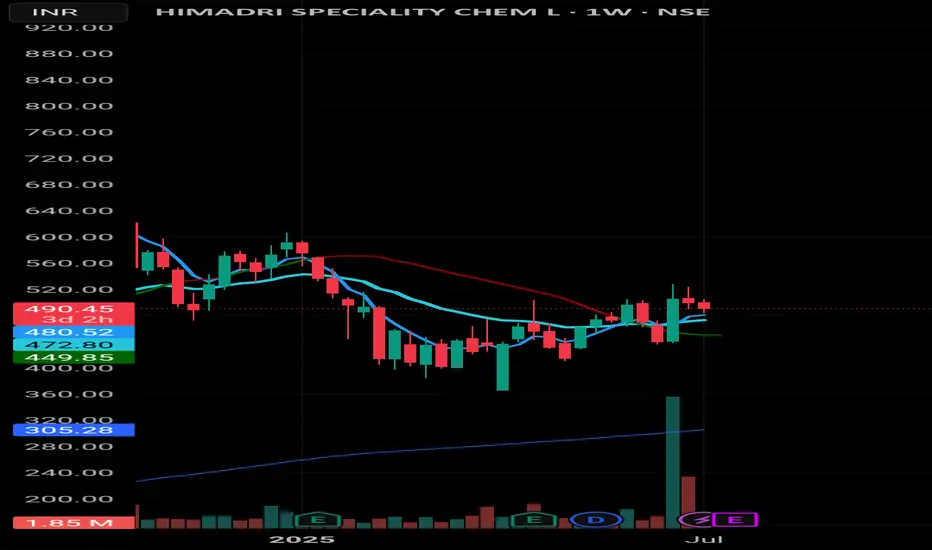
Himadri Speciality Chem – Weekly Chart Update📊 Himadri Speciality Chem – Weekly Chart Update
• Strong volume breakout recently, with price hovering around 480–490 zone
• Price facing resistance near 200 EMA (red line) at ~487.70
• Support zones:
– 472.55 (20 EMA)
– 449.70 (50 EMA)
• Weekly candle formation hints at indecision. Watch next move for breakout or fade.
🎯 Plan Ahead:
If sustains above 488–490, potential upmove towards 520+
If breaks 472, expect retracement till 450–455 range
🔁 Trend is your friend, till it bends.
Not financial advice—just chart reading. Stay sharp. 💹
#Himadri #SwingTrade #PriceAction #VolumeBreakout #NSE #WeeklyAnalysis #TechnicalSetup
Himadri Speciality Chemical Limited (Technical Outlook)Key Observations
Price Levels: The stock is currently near the "Major Resistance" level at ₹505.15, with a potential upside toward ₹676.10 if it breaks through. The "Last Hope" level at ₹459.60 and a deeper retracement level at ₹417.85 are notable support zones.
Moving Averages: The 50 EMA (red line) is trending above the 200 EMA (blue line), indicating a bullish trend. The stock recently crossed above the 50 EMA, suggesting momentum.
Volume: A significant volume spike (54.67M) is visible around mid-2025, coinciding with a price breakout, reinforcing the bullish signal.
Fibonacci Levels: The chart marks Fibonacci retracement levels (0.382 at ₹417.85, 0.618 at ₹505.50), with the stock approaching the 0.618 resistance.
Trend Direction: The upward trajectory post-retracement suggests potential for further gains, with the "Last Hope" level acting as a critical support if the trend reverses.
Technical Outlook
A breakout above ₹505.15 could target ₹676.10, aligning with the "Major Resistance" and upward trendline.
If the stock fails to hold above ₹459.60, it may retrace to ₹417.85 or lower, especially if volume decreases.
Monitor for confirmation with sustained volume and candlestick patterns (e.g., bullish engulfing) near resistance.

How I Read Price Action Like a Pro (Most Miss This Step)The REAL Way to Read Price Action — No Indicators, Just Logic
I make educational content videos for swing trading .

HSCL Price actionHimadri Speciality Chemical Ltd has shown a strong bullish reversal in its latest trading sessions. The stock jumped over 12% in a single day, closing above ₹505 after a previous close near ₹449, supported by high trading volumes and renewed buying interest. Over the past week, the share price has gained nearly 15%, and its three-month return is above 17%. Despite this surge, the stock is still about 24% below its 52-week high, indicating it is recovering from a broader correction.
Technically, a bullish signal was triggered with a recent short-term moving average crossover, which often points to further short-term gains. The company’s fundamentals remain solid, highlighted by strong return on equity, low debt, and a high growth trend, but the stock is trading at elevated valuations compared to sector averages.
In summary, Himadri Speciality Chemical Ltd is experiencing strong short-term momentum with positive technical and fundamental signals, though it remains in recovery mode after earlier declines and is trading at a premium valuation.
Himadri Speciality Chemical Limited (HSCL)Himadri Speciality Chemical Limited (HSCL), If the stock has likely broken out from a bullish pattern with current targets of ₹590–₹650 and strong support at ₹440. Rising volume, DRDO contracts, and promoter buying bolster the bullish outlook. If you meant Hindustan Steelworks Construction Limited, it’s not listed, so no chart pattern applies, but it’s securing significant contracts
Company Overview
Industry: Chemicals (carbon materials, coal pitch, advanced carbon materials).
Market Presence: India’s leading coal pitch manufacturer and the only company producing advanced carbon materials in India.
52-Week Range: High of ₹625 (recent peak), low of around ₹200 (June 2024).
Market Cap: ~₹2,900 crore (estimated based on recent performance).

Stock analysis - Himadri Speciality Chemical Ltd Himadri Speciality Chemical is primarily engaged in the manufacturing of carbon materials and chemicals. It is the No.1 coal pitch manufacturer in India and is the only company to manufacture advanced carbon material in India. It is also the largest player of Naphthalene and SNF in India.
Product Portfolio
The company is a key player across various product segments, including battery materials, coal tar pitch, carbon black, naphthalene, refined naphthalene, SNF, and specialty oils. It serves a diverse range of industries, such as lithium-ion batteries, paints, plastics, tires, aluminum, graphite electrodes, agrochemicals, defense, and construction chemicals.
Fundamental analysis
Comoany have registered highest Ever sales with OPM% of solid 16% highest in last 4 year.
EPS are at highest ever.
Expanding its production capacity with current year CWIP of 105 cr.
Debt is reducing , current Debt to Equity stand as low as 0.10.
ROCE is 19% , highest in last 4 years.
Promoter and institution investor have increased their share holding in recent quaters.
Cons
Stock is trading at 8.52 times its book value and PE of 60.3.
Technical analysis
After taking support from fib.50% level , formed a cup and handle and given breakout with increasing volume , shows bullish momentum with potential to cross all time high in long run.

Stock Analysis: Himadri Speciality Chemical LtdIntroduction:
Himadri Speciality Chemical Ltd id the No.1 company in India who manufactures Coal Pitch.
It is the only company to manufacture the Advance carbon meterial in India. It also produce battery material. It is the largest producer of Naphthalene SNF (Used in construction).
Fundamentals:
M/Cap - 21800cr
P/S Ratio - 4.6
ROE - 16%
P/E - 42 // PEG is very high
EV/EVITDA - 25.4 // Sector - 16
3 Years EPS growth - 95%
OPM keeps on improving (Current 19%)
Strong balance sheet (570cr cash in sheet)
Revenue 50% up in last 2 years
Free cash flow generating company
Promoters buying shares
Decent Share holding pattern
HSCL is doing capex to set up manufacturing plant for #Lithium-ion Batteries with investments around 4800cr.
It is also doing capex of 220cr to increase carbon black capacity.
Technicals:
Resistance: 455, 493, 552, 595, 687
Support: 401, 364

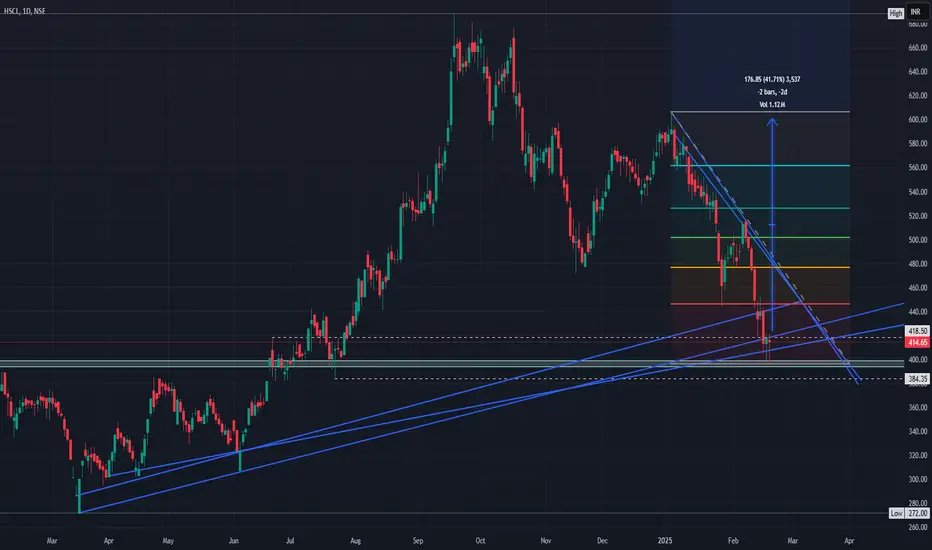
HSCL (NSE) – Technical Analysis (Explanation)Downtrend Correction : The stock has been falling from recent highs but is near key support (~₹412).
Descending Trendline : Price is trying to break above the downward sloping line; a breakout could signal a bullish reversal.
Fibonacci Targets : Potential upside targets are around ₹485, ₹506, and ₹557 if the breakout holds.
Risk Level: A break below ₹412 support may lead to further downside.
Himadri Speciality Chemical Ltd. Himadri Speciality Chemical Ltd. is a leading player in the chemical industry, primarily engaged in the manufacturing of carbon materials and chemicals.
Profitability: The company's profitability has been on an upward trajectory, with significant growth in net profit margins and overall financial stability.
Technical Analysis: On the technical front, Himadri Speciality Chemical Ltd. is exhibiting a Head and Shoulders pattern on the daily time frame, indicating a potential target of 670++

HIMADRI SPECIALITY CHEM LTD TRADING IDEA!📊 Analysis:
HSCL is trading above its key EMAs (20, 50, and 200), indicating a strong bullish trend.
The stock has broken a critical resistance level at ₹590, supported by rising volumes, signaling potential for further upside.
The price structure reflects bullish continuation with solid support below ₹565.
📈 Trading Plan:
Entry Point: ₹595 (enter on a breakout confirmation with good volume).
Target 1 (T1): ₹620
Target 2 (T2): ₹650
Stop Loss (SL): ₹565
🛑 Risk-to-Reward Ratio: Approximately 1:2

VIEW ON HSCLBreakout on the stock
Stock above all its moving averages
Target 592
Stop loss 555
I am just representing my views
For educational purpose only.

HSCL : Momentum Buildng up#HSCL #breakout #momentumtrading #swingtrading
HSCL : Breakout Soon
>> Trending stock
>> Gathering Momentum
>> Strength & Volumes Building up
>> Low Risk High Reward Trade
Swing traders can lock profit at 10% and Keep Trailing
Pls comment, Boost & Follow us if u like the Analysis
Disc : Stock's Chart shared are for learning purpose and not a Trade Recommendation. Do your own analysis and Consult your Financial Advisors before taking any position.

HSCL Trading Above Fresh Weekly Demand ZoneHSCL is currently trading at ₹481.15, slightly above its demand zone between ₹475.4 and ₹441.1, identified on 23rd August 2024. This fresh zone has not been tested, suggesting potential buying interest if the stock revisits this range. Investors may watch for a pullback to these levels, which could present a buying opportunity with strong support.
Disclaimer: This analysis is for informational purposes only and should not be considered as financial advice. Please conduct your own research or consult a financial advisor before making any investment or trading decisions.

Will HSCL bounce from 480 levels ????HSCL looks good around 478-484 range and have support around 470-465 levels so It can be bought with the sl around 468 level can test levels 500+++ 524+++ 575+++ 600+++levels . MAintain proper SL

Hscl around 570 575 levels looks good Aling Trade can be initiated in HSCL with sl around 540- 545 levels for target of 585++ 592+++601+++ 646++

HSCL add in your watch list #HSCL - Himadri Specialty Chemicals, please add to your watchlist
CMP 667
Bullish only above 680
Stock is making VCP pattern and consolidation around 9EMA. It has good volumes
in past few weeks. Can give a good swing trade of 5-7% in the coming days.
Not a buy or sell recommendation, please exercise caution in this volatile week.
Always keep SL.

long on HSCL around 661A long trade can be nitiated on hscl for potential target of around 700-750 levels within a week with strict sl of around 640-635 levels ... maintain proper sl in every trade

Himadri Speciality Chemical Ltd - Breakout Setup, Move is ON...#HSCL trading above Resistance of 603
Next Resistance is at 786
Support is at 471
Here are previous charts:
Chart is self explanatory. Levels of breakout, possible up-moves (where stock may find resistances) and support (close below which, setup will be invalidated) are clearly defined.
Disclaimer: This is for demonstration and educational purpose only. This is not buying or selling recommendations. I am not SEBI registered. Please consult your financial advisor before taking any trade.

Himadri Speciality Chemical Ltd - Breakout Setup, Move is ON...#HSCL trading above Resistance of 471
Next Resistance is at 603
Support is at 301
Here are previous charts:
Chart is self explanatory. Levels of breakout, possible up-moves (where stock may find resistances) and support (close below which, setup will be invalidated) are clearly defined.
Disclaimer: This is for demonstration and educational purpose only. This is not buying or selling recommendations. I am not SEBI registered. Please consult your financial advisor before taking any trade.
