IDEA trade ideas

[Swing] IDEA: Time to take deliveryExpecting a swing in coming days. Delivery trades are good for beginners and people who lose money in intraday.
Caution: Always choose after self analysis and confirmation
idea can do something very good if break 9.40 sl is 7idea can do something very good if break 9.40 sl is 7 very good for short term an long term also....


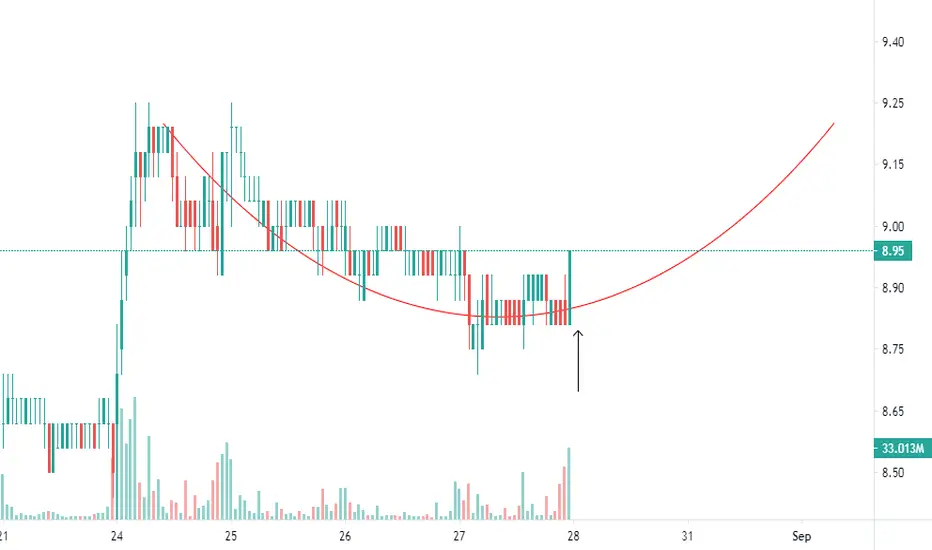
IDEA - NSELooks like the correction is over for NSE:IDEA .
The is reacting to a strong Support level, around ₹8.
We could also clearly see repeated buying at this level.
For nearly a month, the price is trading around this area, but cannot break it down.
Now we see a small price consolidation popping up.
if the price breaks out of this consolidation, we can expect the price to go up.

Vodafone Idea Ltd.Vodafone Idea Ltd. trading with in Inside bar pattern.
Technical indicators are mild bullish.
If price trades above Inside bar 10.10 near by resistance is 12.60 and if price trades below Inside bar 7 near by support is 5.70 on weekly chart.

Expected huge drop in IDEA sharesThe IDEA share is showing a drop in demand. It is expected to go down considerable from price 8.15 Rs . Try shorting at this point.

IDEA long trading opportunity :-)levels mentioned.
Disclaimer: This analysis only for information purpose, do your own analysis before taking any decision.
Trade or invest at your own risk.

ANATOMY OF VODAFONE/IDEATRIANGLE FORMATION
ENTER WHEN ITS BREAKOUT
1ST TGT 12.55=MAJOR RESISTANCE
2ND ENTRY
MAJOR BREAKOUT AREA WAS 13 TO 14
HOLD IT FOR LONG TERM

ANATOMY OF VODA/IDEATRIAGLE PATTERN FORM\
ENTER WHEN ITS BREAKOUT
1ST TARGET 12.55\
2ND TARGET 18\
MAJOR BREAKOUT AREA WAS 13 TO 14 `
THIS IS CONFIRMATION

Idea: Is it a good idea to invest in Idea???Idea
CMP 9
The quarterly results have reflected a huge loss to the tune of 25K Cr loss...
But most of the component of loss were for known reasons.
On charts the stock has support AT 7.8-6.6 levels
Above the red line the stock may signal a breakout...
Keep a close eye.. Consider buying on dips or if you observe a breakout above the red line
Disclosure: This stock has been recommended earlier at when the price was around Rs 4 in the month of January.
Take care & safe trading...!!!
Discliamer:
- The view expressed here is my personal view
- Use this for educational purpose
- Any decision you take you need to take responsibility for the same
- It's your hard earned money. Treat it wisely
- Trade / Invest keeping in mind your trading style, goals and objectives, time horizon & risk tolerance
- Do take proper risk management measures
- Do your own analysis and consult your financial adviser if need be

Go LONG in IDEA with 30 % TargetHi guys this is Trader Kanishk
In this analysis of IDEA
Why to go long with this huge target
has it taken support
trendline breakout
new support levels
new targets
new stoploss levels
entry levels for sharp entry
and many more.
everything have been discussed in the video .
Please
Watch the entire video and
GO for It
DISCLAIMER
Every thing i have discussed in this video is only for educational purpose, do not consider this as a tip, or i am not saying you to buy or sell the stocks. This is all upto you. I am only sharing my analysis and views up to you. Trading is risky, so manage your risk reward before getting enter into any position.
One more very important thing
Guys let me tell you that i am a trader and a trader have a winning probability of 50-65% no any trader is there who have a winning ratio of 100% . Who says you that i am having a 100% winning strategy then F**k these type of people and try to be correct only 50 - 60 % of time which will give you a lot of money if you properly follow the risk reward ratio .

May be a breakout soon Red trend lines will act as Resistance.
Green trend will act as support.
Yellow are the Next Resistance levels as well as Targets.


Idea - support @ 7.75Still in the down ward wedge. Would not suggest to go SHORT as the price vacillates +/- 8%,in a day itself.

Low RISK High REWARD Setup #vodafoneideaLooking to buy the retracement of wave 1 (marked in purple) as close as possible to Rs 8, with stop loss at Rs 6.98 and an immediate target of Rs 12.5.
RiskRewardRatio is 1 : 4.5
P.s. Why i mention this trade could be highly rewarding is because, i have reason to believe we have started Wave 3.
Good Luck.
Cheers !

A long term Idea!There is no point at all in looking at short term time frames in this company given the deep breakdown in its chart structure and deteriorating fundamentals... if at all there would be recovery it is going to be long term... it is still early days but i am seeing a formation of a giant cup structure in the monthly charts and targets are simply based on that.... fundamentals improving in the medium term will further bolster the emerging pattern.
Disclosure: Invested and idea is biased to the core

Voda Idea - not yet bullish!!!Please see the comments in the chart. Nothing fundamental has changed between thursday and Friday. Hence, the conclusion is arrived.

Voda Idea - Retrace?? Not so clearAs per weekly chart, the price has come down to 50% of the rise. And, from there it has closed @ 7.8. So, it seems that it may once again go to 8.55. But, what could be the reasons which can trigger this? As read somewhere Sri. RK Damani had entered at 3.8 in a big way. They may get attracted again.


Bullish Vodafone Idea_ I expect a gain of 1 more Rupee in this script
_ If it crosses 10.60, then we can surely expect the momentum to carry the stock to more highs

Good support for IdeaGood support for Idea, Target around 11.45 - 11.55 (Stop Loss around 9.25)
PS : Only for educational purpose, place trade according to your own understanding & analysis

Idea Vodafone AnalysisIdea at support zone, Long position with Strict SL @ 9.40. Pole and flag pattern, good above 11.50.
