IIFLSEC trade ideas

IIFL Sec - Strength Candle after Low Volatility PeriodIIFL Sec had many candles with low range. Today with range expansion, breakout from low range area has occurred. Swing Trade with low risk

IIFL SECURITIES LONG SIGNALIIFLSEC gave good upside breakout with good volume after 23 days of consolidation.
R:R the setup looks good and can be used for positional trade
Long @ 102.45
T1 113.60 |T2 128|T3 146.05||
SL 95.55

IIFLSECStrong RS + darvas box+ plus 9+21+50 EMA juncture strong reverasal sign of this stock keep in watch

IIFL Securities Swing Trade IdeasLong only if the candle closes above the band with good volume
Stoploss below the support


IIFL Reversal Setup Iifl sec reversal and tight range Volatility contraction seen good up side possible

IIFL SECURITIES IIFL SEC Technical Analysis
CMP- 93.6
SL- 87
Target 1- 103
Target 2- 116
Target 3- 128
Note: this is not a prediction for LONG/SHORT, trade will trigger only on given level as per technical analysis


Target 180 By this Diwali 🔥Company with high TTM EPS Growth
Good quarterly growth in the recent results
Company with Low Debt
Increasing Revenue every quarter for the past 2 quarters
Book Value per share Improving for last 2 years
Company with Zero Promoter Pledge
Recent Results : Growth in Operating Profit with increase in operating margins (YoY)
Poor cash generated from core business - Declining Cash Flow from Operations for last 2 years
Decline in Net Profit with falling Profit Margin (QoQ)
High volume, top losers
Brokers upgraded recommendation or target price in the past three months
Highest Recovery from 52 Week Low
guys now my analysis says going down is over now only goin up rate upto 180 possible by diwali 2021.buy now or u will regret.i m right as always

IIFL securitesClearly moving with 20EMA, posted good results, risky traders can enter it may consolidate or move up as it touched moving average


IIFLSEC Range BreakoutIIFLSEC Range Breakout
Buy IIFLSEC, CP - 75.85
Buy Only On Dip To 65-70
Strict SL - 55 (WCB)
Target - 100


IIFL Securities - Flying in Blue Sky - Will DoubleAscending Triangle Breakout
Very high volumes show accumulation
Tgt: 81-110-143
SL : 48
R:R - 1:4
For education purpose


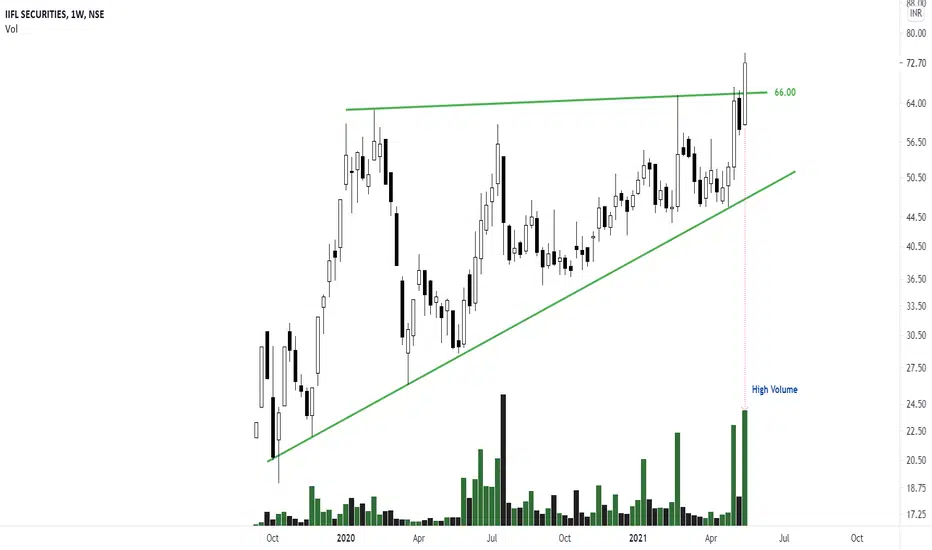
IIFL Securities - Ascending Triangle Pattern BreakoutIIFL Securities has given a ascending triangle pattern breakout with breaking its all time high price of 65.5 on weekly chart.
CMP : 75.85
Target : No Target, Let your profits run as long as your trailing stop isn't hit.
Trailing Stop : 60.5 (10 weeks EMA), will go up every week.
Merits:
1. Ascending Triangle Pattern Breakout
2. Weekly closing above "All time high"
3. Increase in volume by 10 times (Crosses ATH with a weekly volume of 22mn as against an average of 2mn per week).
Happy Trading!!!

IIFLSEC BO DONE WITH HUGE VOLUME. BUY 70 SL 50 TGT 95,125Price was forming nice Ascending Triangle Pattern, and given nice breakout now with huge volume support.
Positional Trade Opportunity
BUY @ 70 SL-50 TGT - 95,125

IIFL Securites Mnthly Flag BreakoutIIFL Securities
Breakout of Flag (consolidation) after almost 1 year plus.
Target width of the flag : 36.20 points
Breakout after a period of consolidation always give better returns.


No Resistance, Only UpmoveSL:- 58.85, T1:- 112.50, Risk/Reward ratio:- 2.87. It moved very well and now after breakout more upmove possible. On weekly time frame it can go 112 almost. Also analyze on your own. Happy Trading...

Ascending triangle chart pattern breakout* Ascending triangle chart pattern breakout with high volume in weekly chart in IIFL SECURITES .