INDIANB trade ideas

Indian Bank Bearish CrabIndian Bank Bearish Crab
Short below 357 with 385 as SL
T1 - 353.7
T2 - 334.5
T3 - 319
T4 - 303.4

INDIAN Bank - short ideaIndian bank has given a good breakout with huge volumes.
In hourly chart the stock is facing resistance at 412
Strict stop loss is advised as this is against the trend.
Short at or below 405 with SL at 412 for T1 390 T2 380 and T3 365

Indian Bank Bullish Cross over in weekly charts on aroon indicator clearly indicates change in trend , time to cross 400 for change in value


Indian bank mid term view Price is above the avg line in Bandbollinger, Selling trend falling in ADX , MACD signal line crossover, RSI positive and in weekly chart Stochastic move to upward direction. These indicators and triangle breakout also helps to move up further
Targets are
284
290
304
308-310.
Stoploss: 263
Vijay,
INDITRADE, Kovilpatti.


Indian Bank Bullish ButterflyThere is Bullish Butterfly but as per our ABCD Entry will be activated at/around 250
There is a case of Double Bottom too but that too needs price to come around 250 levels
1. so our projection is to wait for proper entry
2. desperate trader long tommorow with current candle Low as SL
3. we will wait for price to come more down so we get entry as per our AB=CD = 1.27
4. Rsi is slighest bullish
Target 1 = 38.2% retracement
Target 2 = 61.8% retracement

INDIANB: Looks Good, Bullish Butterfly.....All mentioned & plotted on Chart.
FnO / intraday / Swing levels Updated Later
Don't forget to Click / Tap LIKE button, as Like is Barometer of Usefulness.
Disclaimer: Only For STUDY. For Taking Trade Decision Consult Financial Advisor.


Long on Brake outI am looking this stock to close above 287 to Go long for Target of 300 with stop -3 Points
Regards


Indian Bank - Bullish ChannelIt is dare to touch banking stocks after RBI event still Indian Bank looks strong among PSU banks.
Positional buy set-up: One can buy for target of 320, 340 & 360. Stoploss can be placed around 300.

Possible day trade set up I am looking this stock has made little positive slide towards upper level , and broke the descending TL , the price was basically travelling form TOP of Daily TL to Lower Daily TL , but jumped out form its root , now if this stock is going go up ward then it has to retrace till 310 and then bounce form it , it bounces then this is valid buy set up for considering short term long for day trade only , if price fails to bounce heads downward then consider it will make to 285
here the price can visit 310 and i am looking for reversal sign in order to go long with stop 306 for Target of 319
Lets see how it unfolds
this trade information is only a possible set up, it is not decisive or its not trade recommendation ,
Regards

Rising Wedge on Indian BankRising Wedge pattern on Indian Bank and if the price break the pattern, it leads to hit 295.
Trade:
Short - 309
Target - 295
Stop loss - 317
Reward Points - 14
Risk Points - 8

IndianBank - July 19 Day Trade!Buy above 323 with the stoploss of 320. Targets are 324, 327 and 329. Sell below 318 with the stoploss of 321. Targets are 314, 312 and 309. Trading rules.for "Vanathi Waves" 1. Enter trade after seeing price action for 15 mins. 2. If you are bullish wait for the price action to give entry for long. 3. If you are bearish , wait for the price action to give entry for short. 4. Dont enter trade if there is no clear buy/sell signal. 5. Enter when price action breaks 15 mins high/low.

Indian Bank - Make or break?Price action is trending inside the channel and now nearing the lower band of the channel. Trend line support is seen at 285. Closing below the support zone 285 - 281 will make the price to move towards 278, 265, 258 and 254. If price takes support and bounce back from lower channel /trend line support, it will make the price to move towards 315 and 335.


Breaking down below Channel supportThe Price is moving in a channel, though from last few weeks it has been bearish and doesn't seem to have enough strength to bounce back from the channel support.
I would go short if price closes below 270 for a target of 255.
I would go long If the stock closes above 290.

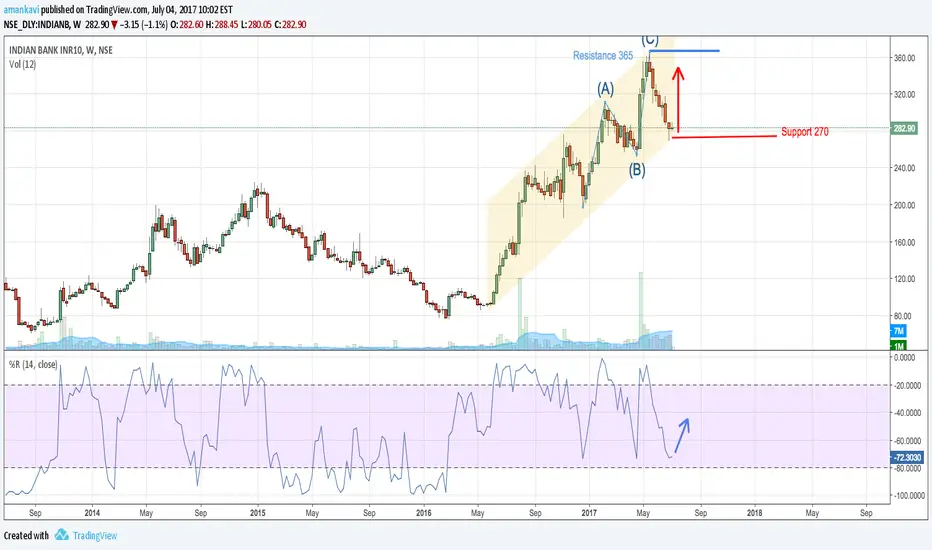
Indian Bank - Bullish ascending channelScrip can show uptrend towards resistance near lower ascending trendline (support)
TP long till 365
Support = As shown in chart

IndianBiNDIANB- Stock can touch 330 in coming days but from there stock have resistance and it will again down may be till 250 as stock weak on monthly chart there is inverted hammer in top.

