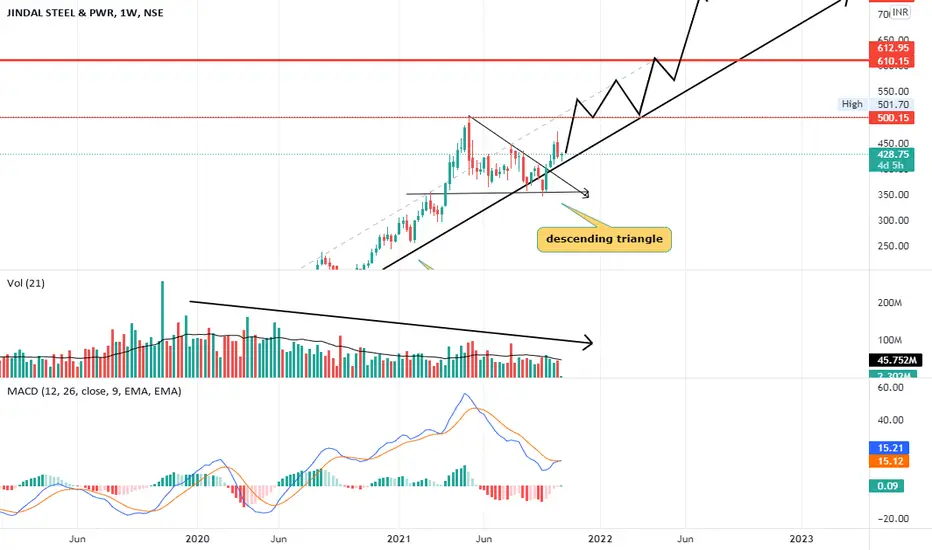
JINDAL STEEL ... MIGHT TRY AND BREAKOUT FROM DESCENDING TRIANGLEVIEW :-
POSITIVE
DISCLOSURE
This is only for educational purpose
This is not a recommendation
I am not SEBI registered
Do not TRADE/INVEST basis what I publish here
I am not responsible for your loss or gain
It is prudent to assume that I have ulterior motives in publishing this Idea
I and my clients might or might not have a position, I and my clients might or might not have a opposite position
JINDALSTEL trade ideas

Jeendal Steel and PowerChart forming assyemtrical triange.
Also Stock announced steller results.
Can show 450/470/496 in short term.

Jindal steel in channel taking spt. if jindal steel break green Line and Close with 1 mint candle it will give good move in down side but if market open with gap down dont buy before it if it open in channel and break the green line it will activate target is Blue Line

JINDAL STEEL : Anticipation of 5th wave (Dhanteras pick)The current structure suggests that after the completion of larger degree 4th wave correction , Jindal steel is rising in its 5th wave progression of impulsive move 12345. Of which we have seen a lower degree impulse wave consisting of 5-waves & post that we have also seen a three wave correction as ABC with C as an ending diagonal on lower time frame. As per the current structure one should go long on current levels with SL of 400 & look for the upside targets of 450/500/550/600.
NOTE: if the SL reached then that should be not taken as bearish event. This idea holds good as long as the level of 350 level is maintained.

Elliot Wave TheroryIf JINDALSTEL hourly candle close below 442 then quit active bears..
And it's may complete wave B & start C wave..
Target of wave C is 400-420 zone
RISK & REWARD is also good..

Jindal Steel Left Eye Right Eye patternJindal Steel Left Eye Right Eye pattern
Jindal Steel Left Eye Right Eye pattern

descending triangle breakout with weekly trendline support 45-degree rally with monthly/weekly trendline
stock halt at 1st major resistance
moving in descending triangle pattern with base 355 and given breakout at 403
now again taking good support of weekly support of trendline.
buy - cmp - 415
stop loss - 400
target - 495 ,520 , 600 with trailing sl method
BUY JINDAL STEEL After a long bullish rally there is a small correction and now could go high form marked point

JINDALSTEEL Positional Long1. Breakout- Retest- Upmove
2. Took support at 50 EMA on Weekly timeframe.
One can look for positional opportunity with SL below 50 EMA.

Jindalstel longJindalstel long
Taking support at 200 day EMA
Strong Candle with above average volume
Buy at CMP- 383
SL- 355
Target- 409, 430, 454
Disclaimer- We are not SEBI registered advisor.
Charts and views are only for educational purpose.

Jindal SteelAll My Discussion And Analysis Are For Educational Purpose And Future References. Please Kindly Ask Or Consult Your Financial Adviser Before Taking Any Investment Or Trading. Thanks //

JINDALSTELJINDALSTEL me ( inverse head and shoulders pattern ) type se bana hua hai aaj jase hi up market opne hota hao to bue jana hai

Bullish Flag Pattern Breakout !Bullish flag formations are found in stocks with strong uptrends and are considered good continuation patterns. They are called bull flags because the pattern resembles a flag on a pole. The pole is the result of a vertical rise in a stock and the flag results from a period of consolidation.

jindalsteel breakoutjindal steel is goin to give booommmmm.it has gien brekout by double bottom pattern..it will reach its all time high...

Intraday trade, go long after a good breakout of the zone. There is pattern in JINDALSTEL , which indicates accumulation rally and then accumulation this is a good sign of up-trending stocks . Let the price break the zone with good volume you can go long for intraday. Place a stop-loss slightly below the zone . Note : The other thing can happen too, if the price breaks the zone downwards with a domination of sellers you can plan for a short trade . But it is suggested to buy as per the current market conditions/trend .


JINDALSTEL - Bullish BreakoutThe stock has broken out of the pattern, and is likely to continue its upward trend.
Considering the current state, the trade can be initiated with a strict stop loss of 400 for targets of 427, 447 and 501.
Please follow us for more trading setups like these.
If you have any queries/suggestions related to above pattern, feel free to type below in the comment section.
Do show your love by pressing the like if you liked the idea.

Seems bullish #JINSALSTEEL-MACD bullish crossover
-Buy signal on supertrend
- Forming inverse head and shoulder

Jindal Steel Break-outCurrently metal sector is down other sectors are on high so prefered metel now metal also break-out so take a entry for swing trade.

intraday stock for 13/20/2021buy jindal steel at 418 for intraday and keep stoploss of 410 and keep target of 430 . intraday buy


FULL LENTH EXPLANATORY ANALYSIS ON JINDAL STEEL AND POWER.Few pointers from my analysis on JINDAL STEEL AND POWER.
1. The stock has been in a significant uptrend , making higher high and higher low formation.
2. The stock has consolidated for good amount of time in the big continuation flag pattern.
3. The stock has been respecting all major Fibonacci retracement levels and has in-fact retraced upto fibo .618 level , which is golden ratio, considered a very healthy retracement on an uptrend.
4.The stock has recently broke out of the flag pattern with decent volumes, can expect a good momentum going forward on shorter-term
5. On RSI as well the breakout and retest has happened.
Entry : can be taken near by 410-415.
Timeframe used : Daily.
Targets:
T1 : 440 (FIBO .236 LEVEL)
T2 : 500 LEVELS (ATH ZONE)
T3 : 540 (PATTERN HIGHT TARGET)
Stop-Loss : 373
Conclusion : overall the setup is Bullish and high-probability for performing going forward.
Disclaimer : This idea was to just give you an insight about my own view and personal observations. Please do your own research or consult an investment advisor before doing any investment or trading.

BREAKOUT AND RETEST DONE OF RESISTANCE LINE !Jindal steel gave a decent breakout from its resistance line and retest is also kind of completed. There is a good chance that stock with touch its previous swing highs.
Some people will call it a falling wedge or falling channel or falling flag etc. But main concept here is that its a breakout of resistance trend line. Keep it simple and powerful.
This analysis was done by me just for understanding the resistance line breakout concept, this is not a stock tip, Feel free to share your views.
