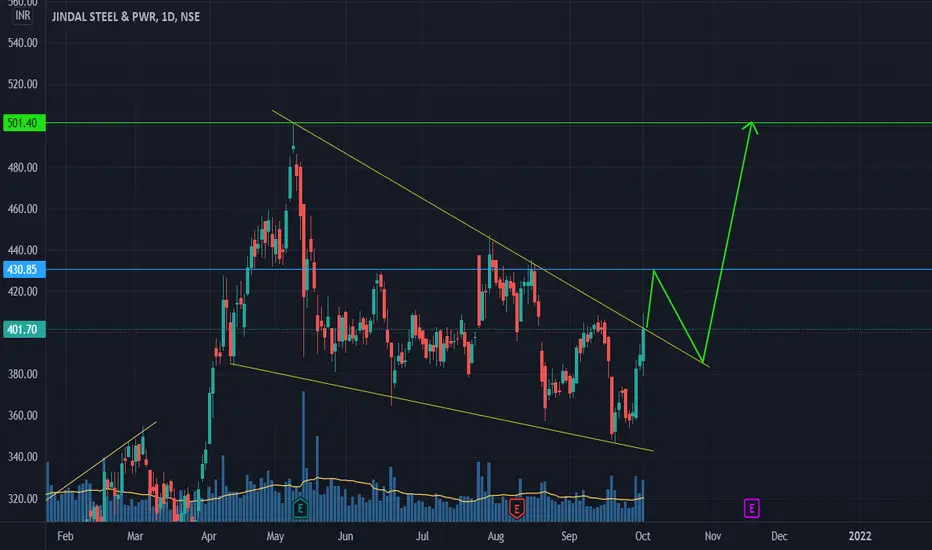
JINDAL STEELWait And Watch ??
Look for Low risk, High reward, and High Probability setups-
Things to Remember while Trading with the Trend
1. Know what the trend is.
2. The best trades are made in the direction of the trend.
3. Assume that the main trendline or moving average will hold.
4. The longer the moving average is, the better it defines the trend.
5. Wait for the pullback.
6. Don’t chase the market.
7. Don’t fight the market.
8. Even in the strongest trends there should be some retracement.
9. The closer the market is to the trendline, the better the risk/reward ratio is.
10. Use ADX to determine the strength of the trend.
11. Higher the level of ADX , the stronger the trend, below 20 consider the market to be choppy
12. Hold trades longer in a strong trend.
13. Wait for confirmation of a trendline breaking before reversing position.
14. Know where the Support levels are.
15. Place stops outside the Support levels.
Thank You..
JINDALSTEL trade ideas

JINDAL STEEL... FALLING WEDGE PATTERNA breakout through the trendline from this pattern can start a new rally. And that will be good news for metal stocks.


Jindal Steel - Trendline Breakout => Breakout the major resistance trendline and closed strongly
=> looking at the rise of volumes confirms it's under bulls control
=> multiple support resistance seen near 430-461, can struggle a bit a over there.
=> levels are marked on the chart, SL - closing below trendline.
Disclaimer => This is only for educational purpose only, Trading involves Substantial risk of loss, pls consult your financial advisor before investing

JINDAL STEEL - SIMPLE PRICE ACTION - #NoRocketScienceSimple price action seen in JINDAL Steel , Trendline breakout on Daily tf. Volumes also look good, will see till the end of week if sustains can BUY for Upside.

JINDALSTEL - Fresh UpmoveJINDALSTEL is following its Weekly Trendline from Covid Lows. Recently took support from the trendline. Buying Activity has been seen in the last week.
If price sustains above 410 then it will test 450 level, and if that it sustained then it will test 500.
JINDLALSTEL
Buy-Above 810
Sl-479
Target- 450 500 New 52Week High

JINDALSTEL | Breakout from falling wedge - Potentially 20%JINDALSTEL | Breakout from falling wedge - Potentially 20%
CMP : 408
SL : 380
Target : 500
1:3+ risk reward setup

FOR LEARNING PURPOSE ONLY. Here Is Jindal Steel For You Guys 👍
If The Metal Sector Looks Good The Stock Will Give Breakout As It Is On The Verge Of Breakout 🚀🚀🚀🚀
Good Targets 🎯 On The Way.
Just Let The 1d Green Close Above The Trendline.
Thank You 🙏

JINDALSTELFalling wedge pattern formation on 1-day timeframe.
Can expect bullish momentum after breakout

opportunity to buy @ 4001.stop loss @ 355
2.first target @435
3.second target @500
near trend line breakout keep in radar see what the next

Swing trade Swing trade setup formed in JSPL in 1Day timeframe. a healthy breakout and a retracement is expected...

Long on jindal Steel JINDALSTEL showing falling wedge pattern breakout . This stock will give upside move up to 500+ projected target in short term period. The MACD bullish crossover has taken place in oversold zone . The relative strength index above 50 has also given confirmation . Candle formation above 50day EMA
Watch out and keep an eye for initial targets of 440 with the stop loss of 370 which will act as a support on lower levels

Falling Wedge Pattern Breakout in JINDALSTELOn Daily Time Frame, JINDALSTEL showing falling wedge pattern breakout. After this breakout expected this stock will give upside move upto 500+ projected target in short term period. Also, MACD bullish crossover in oversold zone indicating trend reversal of this stock. Can go long in this position with downside stop loss below 370 for target of 445 and 500+.


Wedge Breakout on Daily chartBullish Wedge breakout. One can trade at a breakout and retest of the wedge pattern and also consider the horizontal resistance line shown in blue.

ALL METALS ON DISCOUNT GRAB IT Market Cap
₹ 39,707 Cr.
Current Price
₹ 389
High / Low
₹ 502 / 179
Stock P/E
10.4
Book Value
₹ 312
Dividend Yield
0.00 %
ROCE
15.8 %
ROE
14.9 %
Face Value
₹ 1.00
Add ratio to table


Short term trading opportunity in JINDALSTELMetal sector looks strong now after an having consolidation phase, Jindal steel can be seen making an falling wedge on weekly chart. If it breaks 400 level with good volume then it can reach 500 level which was its last high.

Jindal Steel , Long ,Swing TradeGood to go long , Jindal Steel
RSI at 40 and price on 200 Ema on daily chart
price at swing support , can be a good swing trade

Jindal Steel & Power - A Drop coming up?As the Chart tells, It's on a downslide since past few sessions.
Downward trend with a Descending Triangle shows much weakness.
To add on, stock's trading below 200 MA, Could see some serious fall in the coming sessions.
(If it goes as the trend suggest, Price fall could be around 308-310 Levels.

345 is LOC!345 is LOC and should be SL for all long trades. With this SL, one can make a fresh entry for Target 400+
