JINDALSTEL trade ideas

JINDALSTEL: TRADING AT CRUICIAL SUPPORT ZONEJINDALSTEEL(D): TESTING CRUCIAL SUPPORT ZONE, RSI INFLECTION, BULLISH MARKET STRUCTURE...


Jindal Steels is on a winning FlagJindal Steels is on Buy call, as many big Indian Traders confirmed the Flag Pattern and set good Target Points on Jindal Steels

Jindal steel for 28/july/2021Everything is mentioned in the chard
Dont trade without consulting your finencial adviser.
Do comments because that is the only motivation for me.

Jindal Steel - Buy - Good SetupJindal steel is all ready to go higher with your blessings ;)
very good setup, risk reward favorable at CMP.
Buy if it closes above 429.6
Stop = 360
Postional setup


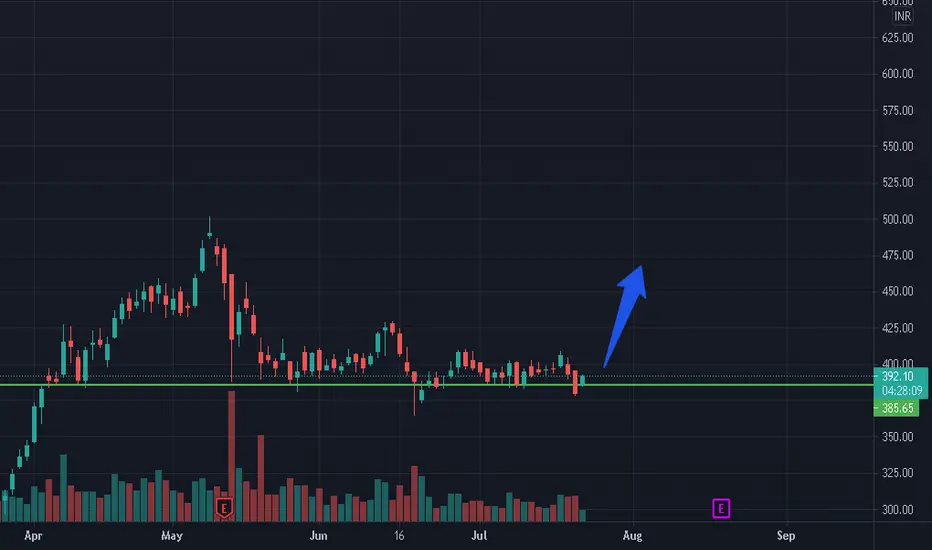
Jindal steel - Upmove possibleJindal steel is respecting a trendline and is bouncing of continuously from 380 levels.
It has made a double bottom sort of a structure hence i am hoping it to continue its uptrend

Jindal Steel and Power - China TradeThe stock has been consolidating after an upmove and taking support around the golden ratio.
With china announcing cuts in production in H2 for steel, global supply will come down which in turn should sustain these high prices.
In that case some indian steel stocks like JSPL, SAIL and Tata Steel Long Products are trading at extremely cheap valuations while producing incredibly high cash flows (which is helping take down their debt quicker than ever anticipated)
Long above 404 with a SL below 384.
First Target 430 and then maybe back to the recent highs.
One of the downsides is high Iron ore & Coal prices so better to look for companies with higher captive capacities.


JINDAL STEEL , Swing trade.
As of now it is on watchlist and looking ata RSI and MACD trade will be taken, if taken coming sessions.


JINDALSTEL Long, Todays Ideas shared in my new Trading view idNSE:JINDALSTEL
JINDALSTEL Long
My New Trading view ID: marketorder09

JINDALSTEL Correction Possible#JINDALSTEL Closing below 280 will welcome bears to take charge. And head towards 320.

Swing Opportunity in Jindal SteelGo Long above 410.8, for Targets of 437.55, and 464.3 with SL 384.05
Reasons to go Long :
1. On a daily timeframe if we draw the Fibonacci retracement tool from recent swing low (point A) to recent swing high (point B) then we see stock took support from 0.618 Fibonacci level.
2. A bullish chart pattern, Double Bottom (W pattern) is formed around 0.618 Fibonacci level.
3. In addition to this the stock will give a Trendline breakout once it crosses 410 level.


How to identify a successful Breakout?Underlying logic:
1. The price gets rejected from a level repeatedly and forms a major resistance.
2. There is an initial test of supply which absorbs some pending orders
3. The price finds a bottom and some sort of accumulation happens.
4. After the accumulation, the price tries to move back up to retest the resistance level.
5. A bull trap is confirmed when the price pierces through the resistance level but there is no follow-up move.
6. But after every test of the supply, it becomes weaker and weaker due to absorption of pending orders(already discussed in older posts)
7. The price finds a bottom again and then another phase of accumulation starts
8. Finally, the price moves up and tries to breakout above the resistance. This time the price manages to break out since the residual supply gets absorbed and it gives a retest.
9. If the breakout is successful, it will be followed by a bullish move and the volume will expand.
10. The retailers buy after the breakout while the institutions buy during the accumulation phase.
Exhibit 1: Clear breakout and clear retest
Exhibit 2: Clear breakout with NO retest of a horizontal level
Exhibit 3: Breakout with consolidation at the resistance level
Sometimes, the price may start consolidating at the resistance level. This is a positive sign because the price is absorbing all the residual supply and is trying to find the equilibrium.
There can be many more different variations, but the underlying concepts remain the same. You can read and revise this post until you master the concepts.
I hope you find this post useful. Also, if anyone is interested in getting a consolidated PDF version of this thread, then you can message me, I'll provide it.
Disclaimer: This is NOT investment advice. This post is meant for learning purposes only. Invest your capital at your own risk.
Happy learning. Cheers!
@johntradingwick


Jindal Steel & Power Limited - Trendline bounceJindal Steel & Power Limited
StopLoss @ 380
Target 1 @ 429
Target 2 @ 478
