Trendline Breakout MFSLTrendline breakout weekly timeframe (chart)
High volume breakout
Rsi above 50 (bullish). Rsi -> 67.
retesting trendline on daily timeframe (chart)
MFSL trade ideas

MAX FINANCIAL SERVICES TARGET 961MAX FINANCIAL services monthly and weekly falling wedge breakout point and max possible to breakout. Weekly bullish. If the monthly and weekly pivot point 806 sustains above this in day it will reach the target 961. Stop loss 747

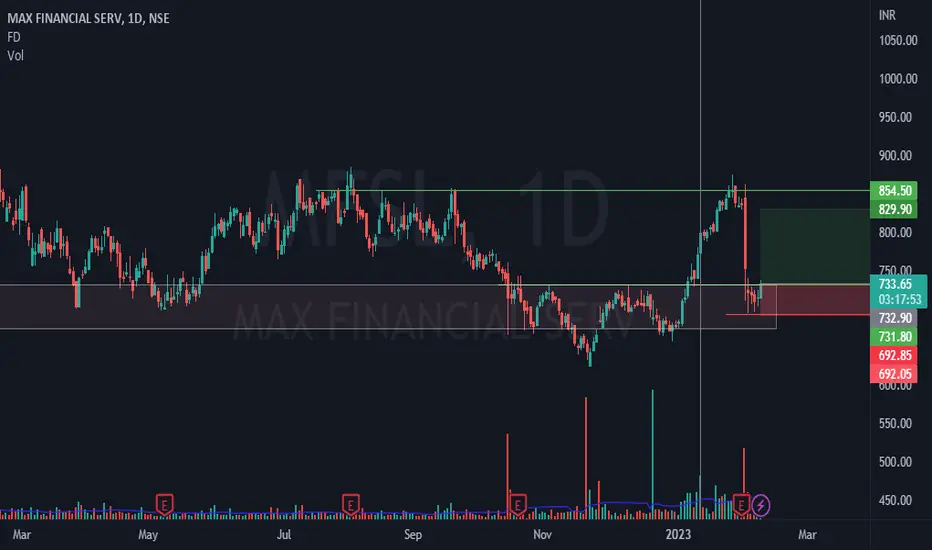
MFSL the MFSL share price is trading at 703.2, which is higher than the price on June 20, 2023. The price has also been moving up in the past few days, and it is currently trading above the 50-day moving average.
The technical analysis that I provided earlier was based on the price data from June 20-22, 2023. Since then, the price has moved up, and the trend is now bullish. The price is still forming a double top pattern, but it is possible that the bears will lose momentum and the price will start to move higher.
Here are some of the factors that could influence the price of MFSL in the near term:
The overall market sentiment
The performance of the company's earnings
Any news or announcements from the company
Any changes in the political or economic environment
It is important to note that technical analysis is not a perfect science, and it is not always accurate. The price of MFSL could continue to fall, even if the technical analysis suggests that the trend is bullish.


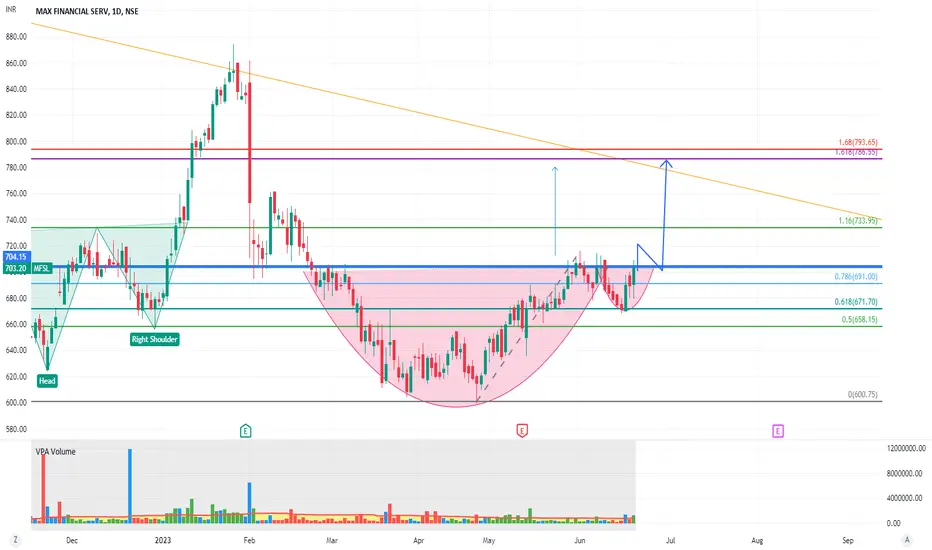
mfsl for swing trade head & shoulder Pattern mfsl for swing trade head & shoulder Pattern break out with good volume

MFSL Breakout BUY!MFSL LONG SETUP
Attached: Daily Chart as of 21st June 2023
- Price has activated an Inverted Head & Shoulders/ Cup & Handle/ Bull Flag Breakout today on the back of High Volumes (Price Volume Pattern BO)
- Laggard from Insurance is finally joining in the Sectoral Rally (Sector Tailwinds)
- The previous Dip halted at 0.382, ABC corrective (Wave 3 or Wave C upside pending)
- Daily RSI crossed above 70 today
- Daily MACD gave a Buy Signal today
Upside Target= 785/ 807🎯📈
Stop Loss= Today's Low (< 710)

MFSL - Chart Analysis || 17th April, 2023 #stocks Analysis Criteria Used:
1. Please find the Chart Analysis done for MFSL
2. The analysis for the Trade ideas, has been done based on Trend analysis and Chart Patterns with Volume Buildups
Focus On:
1. Always keeping your Risk Management in play
2. Using a Stop Loss; because it is your Best Friend
3. Always Plan your Trade and stick to your Plan
4. Dont overthink or overanalyse
5. Treat this as your Business and get serious about it
#sharemarket #stockmarket #nifty #sensex #investing #trading #nse #bse #stockmarketindia #stocks #indianstockmarket #investment #stockmarketnews #banknifty #finance #money #intraday #intradaytrading #investor #niftyfifty #dalalstreet #sharemarketindia #sharemarketnews #stockmarketinvesting #business #sharemarkettips #stock #india #indiansharemarket #rakeshjhunjhunwala #bhfyp #mumbai #share #wealth #investment #market #invest #trading #investing #finance #FinancialFreedom #investor #trader #stocks #profit #investors #economy #equity #shares #nifty #stockexchange
DISCLAIMER:
.
* Please do your own research and/or contact your financial advisor before taking any trading opportunities
** We will not be responsible for your profit or loss
*** We are NOT SEBI REGISTERED
______________________
best stocks to buy today
best stocks to buy now
best stocks to buy
best stocks for Intraday tomorrow
best stocks for long term investment
best stocks to buy today india
best stocks for swing trading
swing trading strategies
swing trading beginners
what is swing trading
swing trading stocks
swing trading stock selection
swing trading kya hai
nifty analysis
nifty view
bank nifty analysis
top stocks to buy now
strong stocks
nifty view
nifty prediction
stock market view tomorrow
bank nifty Levels
bank nifty prediction
share news
stock market news
best stocks to buy now
profit booking stocks
multibagger stocks in discount
breakout stocks
best short term stocks
best short term shares
next multibagger stocks

Max Financial Services Analysis Stock is trading higher on daily chart with good volume and near to Trendline BO on chart, follow chart for proper entry and exit levels.

Go Long on MFSLBuy MFSL Targets Mentioned in the chart
Great potential on the upside with breakout of the order block and consolidation


MFSL is breakout labeMFSL is breakout label keep on radar for 1 month as this stock is retest from 0.618 and it will go up to 1.618
LONG TRADEhourly candle crossing and closing above given resistance box
eyeing for target 700-704.4
dislcaimer - trade @ own risk


MFSL - Intraday Trade || 9th June, 2023 #stocks Previously given as a Swing Trade (15th April). It has already achieved our T1 & T2 and currently heading towards our T3.
To be traded for Intraday today
9th June, 2023
MFSL
Intraday Stock Trade Idea
(1D TF)
#intraday #stocks #priceaction
Analysis Criteria Used:
1. Please find the Chart Analysis done for the Intraday Trade Idea levels for 9th June, 2023
2. The analysis for the Trade ideas, has been done based on Trend analysis and Chart Patterns with Volume Buildups
Focus On:
1. Always keeping your Risk Management in play
2. Using a Stop Loss; because it is your Best Friend
3. Always Plan your Trade and stick to your Plan
4. Dont overthink or overanalyse
5. Treat this as your Business and get serious about it
#sharemarket #stockmarket #nifty #sensex #investing #trading #nse #bse #stockmarketindia #stocks #indianstockmarket #investment #stockmarketnews #banknifty #finance #money #intraday #intradaytrading #investor #niftyfifty #dalalstreet #sharemarketindia #sharemarketnews #stockmarketinvesting #business #sharemarkettips #stock #india #indiansharemarket #rakeshjhunjhunwala #bhfyp #mumbai #share #wealth #investment #market #invest #trading #investing #finance #FinancialFreedom #investor #trader #stocks #profit #investors #economy #equity #shares #nifty #stockexchange
DISCLAIMER:
.
* Please do your own research and/or contact your financial advisor before taking any trading opportunities
** We will not be responsible for your profit or loss
*** We are NOT SEBI REGISTERED
______________________
best stocks to buy today
best stocks to buy now
best stocks to buy
best stocks for Intraday tomorrow
best stocks for long term investment
best stocks to buy today india
best stocks for swing trading
swing trading strategies
swing trading beginners
what is swing trading
swing trading stocks
swing trading stock selection
swing trading kya hai
nifty analysis
nifty view
bank nifty analysis
top stocks to buy now
strong stocks
nifty view
nifty prediction
stock market view tomorrow
bank nifty Levels
bank nifty prediction
share news
stock market news
best stocks to buy now
profit booking stocks
multibagger stocks in discount
breakout stocks
best short term stocks
best short term shares
next multibagger stocks


MFSLMFSL made rounding bottom formation pattern on daily charts with good volumes.
Not to be missed breakout with very good Risk:Reward Ratio.
Could be bought with mentioned stoploss & target.

MFSL Cmp 634 Parallel ChannelMax Financial Services Cmp 634 6-4-2023
1. Parallel channel Consolidation, moved above mid line.
2. RSI Divergence
Buy above 637 for tgt of 650-670-680-700-710 SL 610
It is just a view, please trade at your own risk.

MFSLPrice is taking trend line support and had a huge volume recently. Near to the trend line the price has formed a consolidation zone between 610 and 635. It is buy on dips when the price is having a pull back. Buy above 630 - 635 with the stop loss of 615 for the targets 650, 675 and 710. This is not a recommendation to buy/sell. Do your own analysis.

Short term trade setup in MFSLIt appears that the price has hit its lowest point and is now showing indications of a reversal. This is evident as it has broken out of a period of consolidation or uncertainty and is moving in an upward direction. This pattern is commonly known as the Diamond Bottom pattern, which typically occurs during a downward trend. The pattern is characterized by a broadening pattern of higher highs and lower lows, which gradually narrows as the lows start trending upward after the highs peak. Once the price breaks out of the diamond's boundary lines in an upward direction, it signifies a significant shift to a new uptrend.
Target has been Marked.

"W" Pattern breakouttCan do 700 plus.
SL red line
Entry blue line
Target green line.
PS : Pls consult your advisor for investing / trading.
Only for learning purpose.
