#Nifty Weekly 16-02-26 to 20-02-26#Nifty Weekly 16-02-26 to 20-02-26
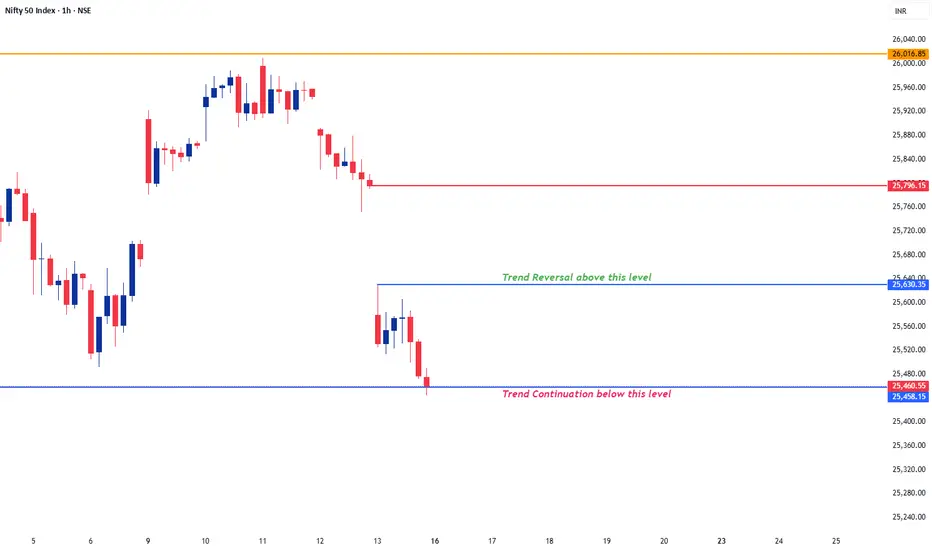
25450-25650 is the sideways range for next week.
25800 will act as Resistance for next week.
Wait for above range to break on either side for a trending move.
Long level is above 25650 for the targets of 25780/25900.
Short level is below 25450 for the targets of 25
Nifty 50 Index
No trades
About Nifty 50 Index
NIFTY 50 is the main index for the National Stock Exchange of India (NSE). It tracks the performance of the top 50 stocks by market capitalization from 13 sectors of the Indian economy. With such a relatively small number of companies within the index it still represents over 60% of the free float market capitalization of the stocks listed on NSE, and serves as a benchmark for fund portfolios and index funds. The list of the NIFTY 50 Index constituents is rescheduled every 6 month.
Related indices
Nifty - Weekly Review Feb 16 to Feb 20We have two unfilled gaps. 25630 to 25750 and 25440 to 25110. These gaps can act as strong support or resistance. The price sustaining above or below these levels can decide the trend direction.
Buy above 25520 with the stop loss of 25460 for the targets 25560, 25600, 25660, 25720, 25800, and 25860.

Nifty Analysis for Feb 16-18, 2026Wrap up:-
Nifty is now in wave 3 of major wave c, in which wave 1 is completed at 25641 and wave 2 is in progress which is making a abc/wxy corrected pattern of which wave a or w is completed at 25685 and currently, wave x or b is expected to be completed at 25444 once nifty breaks and sustains ab

#NIFTY Intraday Support and Resistance Levels - 13/02/2026Nifty is expected to open with a gap down today around the 25780–25800 zone, indicating early weakness compared to yesterday’s close. Price is currently hovering just above the immediate support near 25750, which makes this level very crucial for the opening session. The first 15–30 minutes will dec

Dont waste your time & MoneyNIFTY 50 Unless its move up than 25655 or move below than 25368 (both closing) cant expect any trade for the day.. till then enjoy some music

Nifty - Expiry day analysis Feb 10Today, the price moved in a line formation, which can result in a gap-up or gap-down opening tomorrow. Price is bullish as long as it sustains above 25800.
Strong resistance is at the 26300 zone.
Strong support is at the 25500 zone.
Buy above 25860 with the stop loss of 25800 for the targets 25920,

NIFTY: detailed Trading levels and Plan for 13-Feb-2026📅 Nifty 50 Trading Plan: 13-Feb-2026
Current Context: Nifty closed at 25,796.15 on Feb 12. The index is currently testing a "make-or-break" support zone between 25,700 and 25,782.
🟢 Scenario 1: Gap Up Opening (Above 25,900)
A Gap Up of 100+ points would place Nifty above the crucial 25,900 mark, wh

NIFTY : Trading levels and Plan for 11-Feb-2026📘 NIFTY Trading Plan – 11 Feb 2026
(Timeframe: 15-Min | Instrument: NIFTY 50 | Educational Purpose Only)
🔑 Key Intraday Levels (From Chart)
🟢 26,156 – Higher Timeframe Resistance
🟢 25,917 – Immediate Resistance
🟠 25,859 – 25,917 – Opening Support / Resistance (No-Trade Zone)
🟢 25,776 – Last Intra

What is Short Selling? – The Beginner’s GuideShort selling is the practice of selling securities that an investor does not currently own. The investor sells them with the expectation that the price will decline. Later, the investor buys them back at a lower price to earn a profit.
In simple words, short selling means selling a borrowed instru

NIFTY 15-Min Pullback Buy from Demand Zone (RSI Confirmation)This trade idea is based on a pullback / mean-reversion setup on the NIFTY 50 in the 15-minute timeframe.
Currently, price has declined into a strong demand / support zone around 25,440–25,460, and the RSI is in oversold territory, indicating selling pressure may be exhausting. However, since the s

See all ideas
Summarizing what the indicators are suggesting.
Oscillators
Neutral
SellBuy
Strong sellStrong buy
Strong sellSellNeutralBuyStrong buy
Oscillators
Neutral
SellBuy
Strong sellStrong buy
Strong sellSellNeutralBuyStrong buy
Summary
Neutral
SellBuy
Strong sellStrong buy
Strong sellSellNeutralBuyStrong buy
Summary
Neutral
SellBuy
Strong sellStrong buy
Strong sellSellNeutralBuyStrong buy
Summary
Neutral
SellBuy
Strong sellStrong buy
Strong sellSellNeutralBuyStrong buy
Moving Averages
Neutral
SellBuy
Strong sellStrong buy
Strong sellSellNeutralBuyStrong buy
Moving Averages
Neutral
SellBuy
Strong sellStrong buy
Strong sellSellNeutralBuyStrong buy
Displays a symbol's value movements over previous years to identify recurring trends.
Frequently Asked Questions
The current value of Nifty 50 Index is 25,682.75 INR — it has risen by 0.83% in the past 24 hours. Track the index more closely on the Nifty 50 Index chart.
Nifty 50 Index reached its highest quote on Jan 5, 2026 — 26,373.20 INR. See more data on the Nifty 50 Index chart.
The lowest ever quote of Nifty 50 Index is 279.00 INR. It was reached on Jul 3, 1990. See more data on the Nifty 50 Index chart.
Nifty 50 Index value has decreased by −0.80% in the past week, since last month it has shown a −0.05% decrease, and over the year it's increased by 11.20%. Keep track of all changes on the Nifty 50 Index chart.
The top companies of Nifty 50 Index are NSE:RELIANCE, NSE:HDFCBANK, and NSE:BHARTIARTL — they can boast market cap of 212.09 B INR, 153.83 B INR, and 126.10 B INR accordingly.
The highest-priced instruments on Nifty 50 Index are NSE:MARUTI, NSE:ULTRACEMCO, and NSE:BAJAJ_AUTO — they'll cost you 15,051.00 INR, 12,981.00 INR, and 9,697.50 INR accordingly.
The champion of Nifty 50 Index is NSE:SHRIRAMFIN — it's gained 97.01% over the year.
The weakest component of Nifty 50 Index is NSE:WIPRO — it's lost −31.22% over the year.
Nifty 50 Index is just a number that lets you track performance of the instruments comprising the index, so you can't invest in it directly. But you can buy Nifty 50 Index futures or funds or invest in its components.
The Nifty 50 Index is comprised of 50 instruments including NSE:RELIANCE, NSE:HDFCBANK, NSE:BHARTIARTL and others. See the full list of Nifty 50 Index components to find more opportunities.