NIFTY Analysis 30 SEPTEMBER, 2025 ,Daily Morning update at 9 amTrading Skill Self-Check (Before Trading and traning)
Evaluate yourself
Can you identify support & resistance levels accurately?
Can you spot Doji, engulfing, or pin bar patterns?
Can you calculate FAKE levels using 1- 4 hour chart?
Can you judge overbought/oversold zones in intraday charts?
About Nifty 50 Index
NIFTY 50 is the main index for the National Stock Exchange of India (NSE). It tracks the performance of the top 50 stocks by market capitalization from 13 sectors of the Indian economy. With such a relatively small number of companies within the index it still represents over 60% of the free float market capitalization of the stocks listed on NSE, and serves as a benchmark for fund portfolios and index funds. The list of the NIFTY 50 Index constituents is rescheduled every 6 month.
Related indices
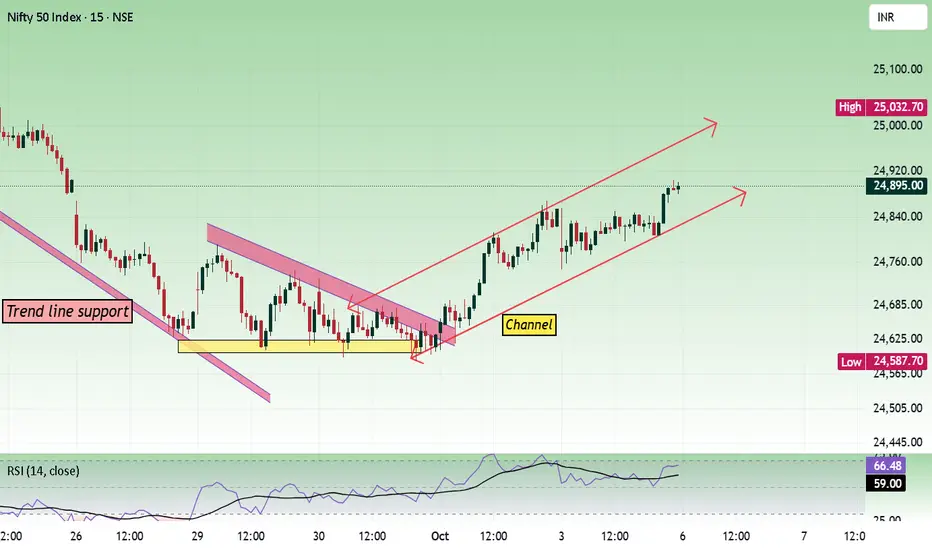
Nifty - Weekly Review Oct 6 to Oct 10In a lower time frame, the price is moving within an ascending channel. Channel movement requires more patience to identify trade setups and execute them. In the daily time frame, the price is taking a trendline support.
Nearby resistance is seen at the 25000 zone.
Buy above 24920 with the stop los
“Nifty 50 Intraday Key Levels | Buy & Sell Zones” 3rd Oct 2025“Want to learn more? Like this post and follow me!”
25,073 → Above 10m closing Shot Cover Level
25,070 → Below 10m hold PE By Safe Zone
24,988 → Above 10m hold CE By Entry Level
24,980 → Below 10m hold PE By Risky Zone
24,888 → Above 10m hold Positive Trade View
24,790 → Above Ope

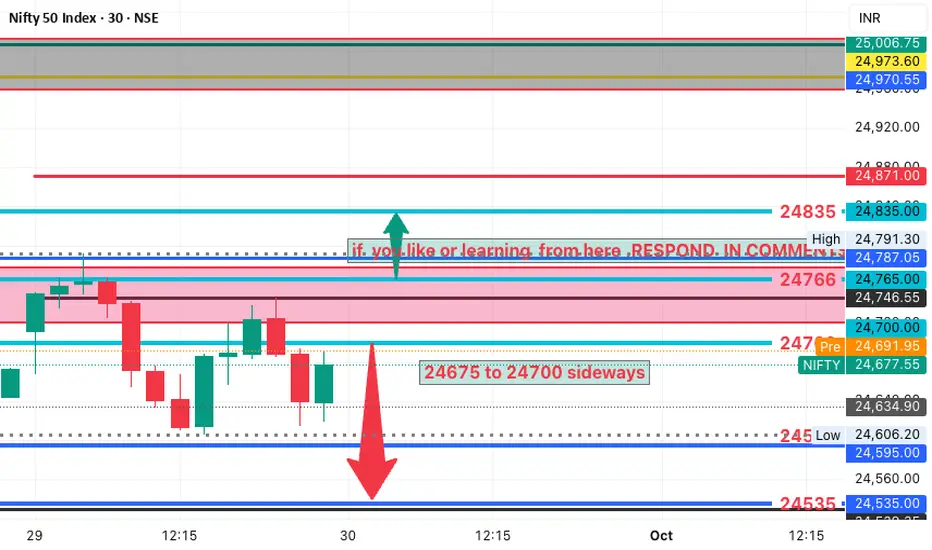
Daily analysis for Nifty50: 29/09/25Nifty is still not bullish. A trendline support test is quite possible. That comes at around 24535-24520 range of price. If that is breaching it will test lower levels of 24560, 24405 and 24360 as downside fall.
On bounce it will rise till 24630 to 24740 as resistance.

Nifty view for this weekAny positive opening tomorrow must sustain above 24600/24650 levels then can initiate long above 24680 for targets of 24850/24880/24950 with SL 1hour sustain below 24600. If break and close below 24600 then further fall can be seen.
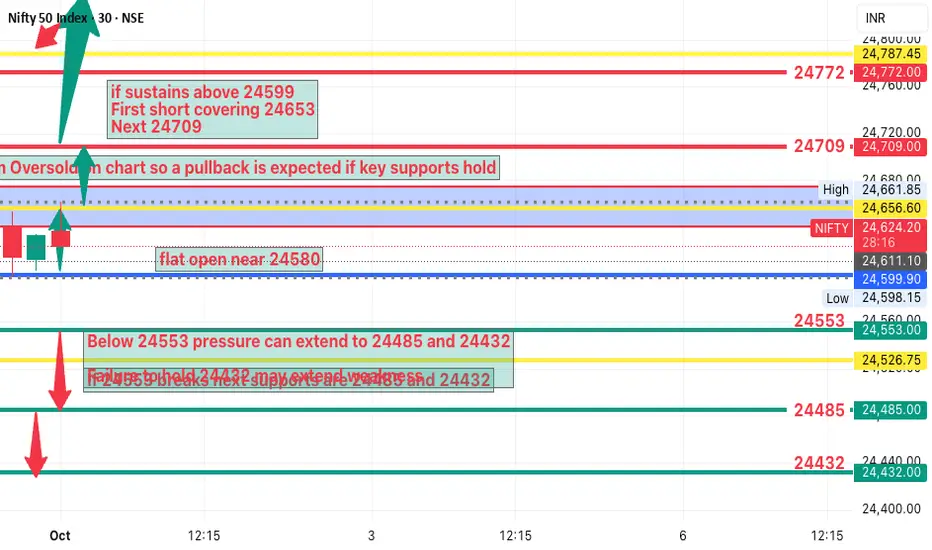
NIFTY Analysis 1 october 2025 ,Daily Morning update at 9 amMarket closed at a critical breakdown level
pattern Sideways for last 3 sessions
Momentum Oversold,so a pullback is expected if key supports hold
First half may see dip 24553 zone is crucial support
If holds and bounces above 24599 expect short covering rally towards 24709 and 24840
If breaks belo
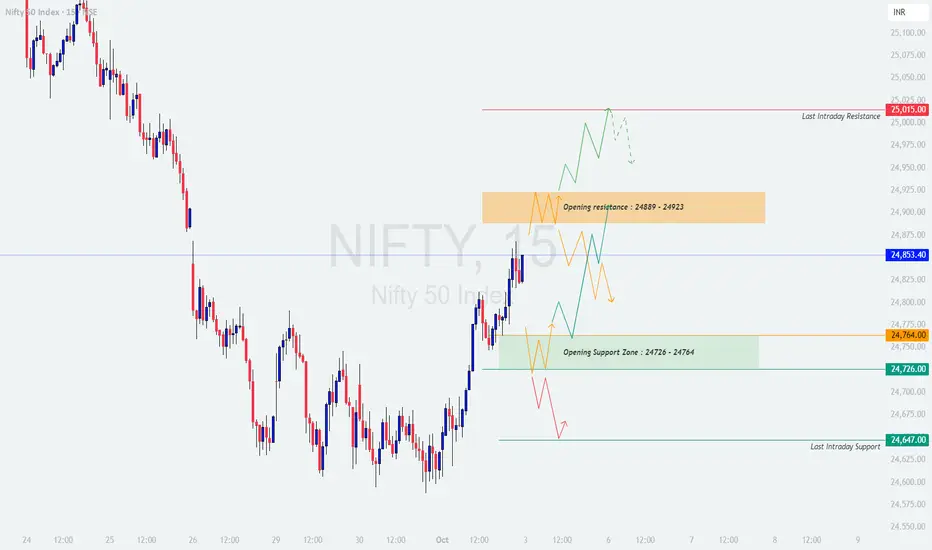
NIFTY : Trading levels and plan for 03-Oct-2025NIFTY TRADING PLAN – 03-Oct-2025
Nifty closed at 24,853.40, recovering from recent declines and now trading near crucial resistance and support zones. Tomorrow’s movement will largely depend on whether the index can break above 24,889 – 24,923 (Opening Resistance Zone) or hold below 24,726 – 24,76
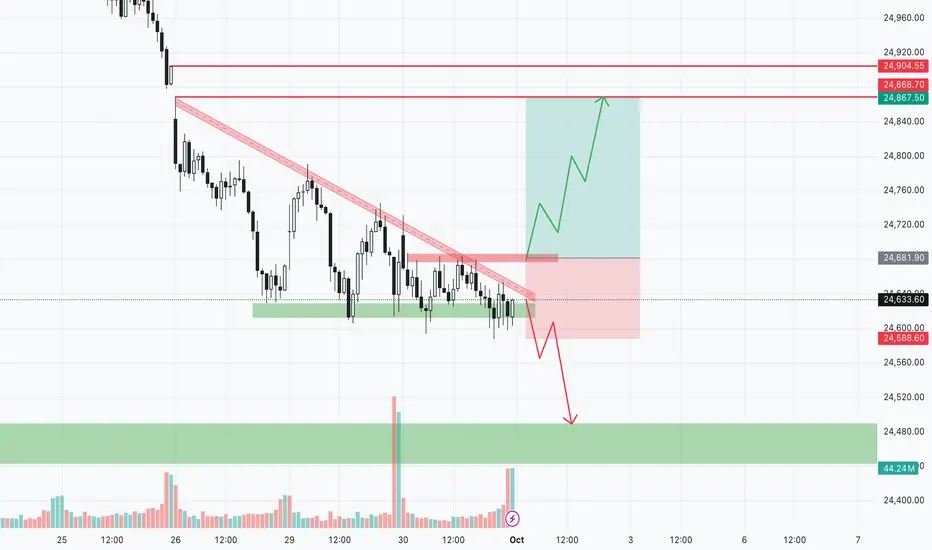
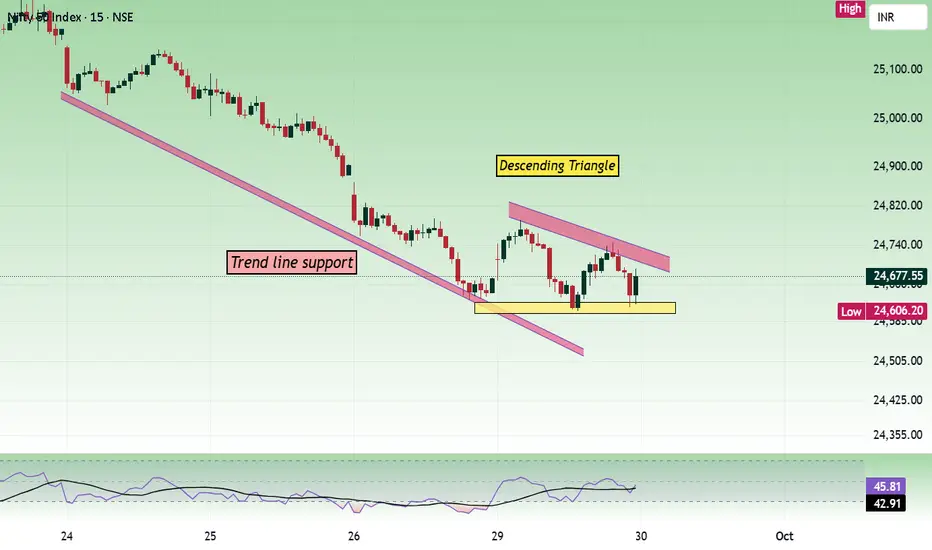
Nifty - Monthly Expiry Day Analysis Sep 30The price was holding the support at the 24600 zone and moved within the range of 24600 to 24800 today, forming a descending triangle in the process. 24600 is the trend direction deciding zone now.
Buy above 24660 with the stop loss of 24610 for the targets 24700, 24740, 24800, 24840, and 24880.
Sel
“Nifty 50 Intraday Key Levels | Buy & Sell Zones” 6th Oct 2025Key Levels for Tomorrow:
25,120 → Above 10m closing Short Cover Level (CE Safe Zone)
Below 10m hold PE (Risky Zone)
25,023 → Above 10m hold CE (Entry Level)
Below 10m hold PE (Risky Zone)
24930 → Above 10m hold → Positive Trade View

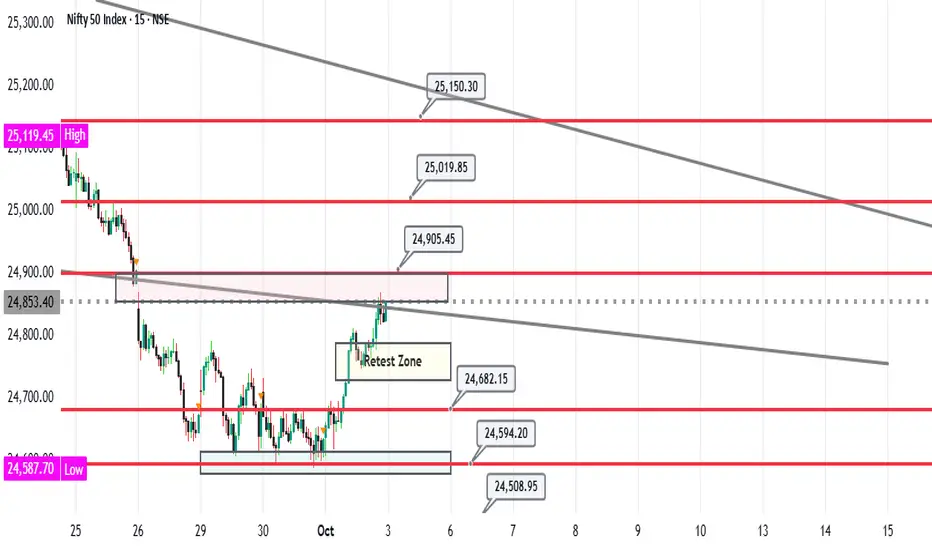
Nifty analysis - 3/10/25 As we saw strong bullish movement we might see a retest or SL hunting should happen as most of retailers might have carry forward CE trades. Look for CE trades after we cross 24910 with the targets marked on chart. Look for PE if a 15 minutes candle closes below 24680 and we can see the targets mark
See all ideas
Summarizing what the indicators are suggesting.
Oscillators
Neutral
SellBuy
Strong sellStrong buy
Strong sellSellNeutralBuyStrong buy
Oscillators
Neutral
SellBuy
Strong sellStrong buy
Strong sellSellNeutralBuyStrong buy
Summary
Neutral
SellBuy
Strong sellStrong buy
Strong sellSellNeutralBuyStrong buy
Summary
Neutral
SellBuy
Strong sellStrong buy
Strong sellSellNeutralBuyStrong buy
Summary
Neutral
SellBuy
Strong sellStrong buy
Strong sellSellNeutralBuyStrong buy
Moving Averages
Neutral
SellBuy
Strong sellStrong buy
Strong sellSellNeutralBuyStrong buy
Moving Averages
Neutral
SellBuy
Strong sellStrong buy
Strong sellSellNeutralBuyStrong buy
Displays a symbol's price movements over previous years to identify recurring trends.
Frequently Asked Questions
The current value of Nifty 50 Index is 25,001.75 INR — it has risen by 0.23% in the past 24 hours. Track the index more closely on the Nifty 50 Index chart.
Nifty 50 Index reached its highest quote on Sep 27, 2024 — 26,277.35 INR. See more data on the Nifty 50 Index chart.
The lowest ever quote of Nifty 50 Index is 279.00 INR. It was reached on Jul 3, 1990. See more data on the Nifty 50 Index chart.
Nifty 50 Index value has increased by 0.31% in the past week, since last month it has shown a 1.13% increase, and over the year it's decreased by −0.72%. Keep track of all changes on the Nifty 50 Index chart.
The top companies of Nifty 50 Index are NSE:RELIANCE, NSE:HDFCBANK, and NSE:BHARTIARTL — they can boast market cap of 207.96 B INR, 167.02 B INR, and 121.76 B INR accordingly.
The highest-priced instruments on Nifty 50 Index are NSE:MARUTI, NSE:ULTRACEMCO, and NSE:BAJAJ_AUTO — they'll cost you 15,806.00 INR, 12,019.00 INR, and 8,679.50 INR accordingly.
The champion of Nifty 50 Index is NSE:BEL — it's gained 50.03% over the year.
The weakest component of Nifty 50 Index is NSE:TRENT — it's lost −36.38% over the year.
Nifty 50 Index is just a number that lets you track performance of the instruments comprising the index, so you can't invest in it directly. But you can buy Nifty 50 Index futures or funds or invest in its components.
The Nifty 50 Index is comprised of 50 instruments including NSE:RELIANCE, NSE:HDFCBANK, NSE:BHARTIARTL and others. See the full list of Nifty 50 Index components to find more opportunities.