Cryptocurrency as a Digital Asset1. What is a Cryptocurrency?
At its core, a cryptocurrency is a digital or virtual currency that relies on cryptography for security. Unlike physical currencies issued by governments (fiat money), cryptocurrencies operate on decentralized networks based on blockchain technology—a distributed ledger maintained by a network of computers (nodes). These digital assets can be used as a medium of exchange, a store of value, and a unit of account, although their adoption varies widely.
The first and most widely known cryptocurrency is Bitcoin, introduced in 2009 by the pseudonymous creator Satoshi Nakamoto. Bitcoin was designed as a peer-to-peer electronic cash system, enabling users to transact without intermediaries like banks. Since then, thousands of alternative cryptocurrencies (altcoins) have emerged, each with unique features, purposes, and communities.
2. Characteristics of Cryptocurrencies as Digital Assets
Cryptocurrencies possess distinct characteristics that differentiate them from traditional assets:
a. Decentralization
Unlike centralized financial systems controlled by banks or governments, cryptocurrencies operate on decentralized networks. This decentralization reduces reliance on intermediaries, enhances transparency, and mitigates single points of failure in financial systems.
b. Digital Nature
Cryptocurrencies exist solely in digital form, making them easily transferable across borders, instantaneously, without the need for physical exchange. This digital nature allows for programmable transactions, automated contracts, and integration with emerging technologies like smart contracts and decentralized finance (DeFi).
c. Security and Immutability
Transactions are secured using cryptographic algorithms. Once recorded on a blockchain, transactions are immutable, meaning they cannot be altered or deleted. This feature enhances trust and integrity in digital financial transactions.
d. Scarcity and Supply Mechanisms
Many cryptocurrencies, like Bitcoin, have a fixed maximum supply. Bitcoin, for instance, has a cap of 21 million coins. This scarcity creates a potential store of value similar to precious metals, and it can influence market dynamics through supply-demand mechanisms.
e. Volatility
Cryptocurrencies are notorious for price volatility. The same digital asset may experience significant fluctuations in a single day due to speculative trading, adoption news, regulatory announcements, or macroeconomic factors. While this volatility presents high-risk opportunities for traders, it can also pose challenges for long-term investors.
3. The Technology Behind Cryptocurrencies
The backbone of cryptocurrencies is blockchain technology—a distributed ledger that records all transactions across a network of computers. Key technological aspects include:
a. Blockchain
A blockchain is a chain of blocks containing transaction records. Each block is linked to the previous one using cryptographic hashes, creating a secure, immutable record. Blockchains can be public (like Bitcoin and Ethereum) or private/permissioned (used by enterprises).
b. Consensus Mechanisms
Cryptocurrencies rely on consensus mechanisms to validate transactions without a central authority. Common mechanisms include:
Proof of Work (PoW): Miners solve complex mathematical problems to validate transactions (e.g., Bitcoin).
Proof of Stake (PoS): Validators are chosen based on the number of coins they hold and are willing to “stake” (e.g., Ethereum 2.0).
Other mechanisms: Delegated Proof of Stake (DPoS), Proof of Authority (PoA), and hybrid models.
c. Smart Contracts
Smart contracts are self-executing contracts with terms directly written into code. They run on blockchain platforms like Ethereum and enable decentralized applications (DApps) for lending, insurance, gaming, and other financial services.
d. Wallets and Keys
Cryptocurrency ownership is represented by cryptographic keys:
Public key: Acts like an address for receiving funds.
Private key: Acts as a password for authorizing transactions. Proper management of private keys is crucial for asset security.
4. Cryptocurrencies as an Investment Asset Class
Cryptocurrencies have evolved from speculative instruments to a recognized asset class in global finance. Investors view them through various lenses:
a. Store of Value
Bitcoin is often referred to as “digital gold” due to its limited supply and potential to hedge against inflation. Unlike fiat currency, whose value may erode due to monetary expansion, Bitcoin offers a deflationary characteristic.
b. Diversification
Cryptocurrencies provide portfolio diversification due to their low correlation with traditional asset classes like equities and bonds. Including crypto assets in an investment portfolio can enhance risk-adjusted returns.
c. High-Risk, High-Reward
The cryptocurrency market is volatile and speculative. While early adopters have earned significant returns, the market is also prone to crashes. Understanding risk tolerance, time horizon, and market cycles is critical for investors.
d. Yield Opportunities
Beyond price appreciation, cryptocurrencies offer opportunities for earning yields through mechanisms like staking, lending, and decentralized finance protocols.
5. Market Dynamics and Trading
The cryptocurrency market operates 24/7, unlike traditional stock markets. Key factors influencing crypto prices include:
Supply and demand: Limited supply and growing adoption can drive prices higher.
Speculation: Retail and institutional investors’ buying/selling patterns create volatility.
Regulatory news: Announcements regarding crypto regulations significantly impact market sentiment.
Technological developments: Upgrades, forks, and innovations affect the value of specific cryptocurrencies.
Macro trends: Inflation, monetary policy, and geopolitical events influence crypto markets indirectly.
Trading strategies in cryptocurrency markets range from long-term holding (HODLing) to intraday trading, arbitrage, and algorithmic trading. Each strategy carries its own risk-reward profile.
6. Risks Associated with Cryptocurrencies
Investing or trading in cryptocurrencies comes with multiple risks:
Volatility Risk: Prices can swing dramatically within hours.
Regulatory Risk: Governments can impose bans, restrictions, or heavy taxation.
Security Risk: Hacks, scams, and wallet mismanagement can lead to loss of funds.
Liquidity Risk: Smaller cryptocurrencies may have low trading volumes, making it difficult to enter or exit positions.
Technological Risk: Bugs, forks, or software vulnerabilities can compromise networks or assets.
Investors must conduct thorough research, employ security best practices, and consider risk management strategies before entering the crypto market.
Conclusion
Cryptocurrencies as digital assets represent one of the most profound financial innovations of the 21st century. By combining cryptography, decentralized networks, and digital scarcity, they have created a new paradigm for value exchange. Investors, technologists, and regulators continue to explore their potential, benefits, and risks.
While volatility, security, and regulatory uncertainty present challenges, the long-term prospects for cryptocurrencies remain promising. They offer an alternative financial system that is borderless, programmable, and transparent, potentially transforming the way we think about money, investments, and global trade. As adoption grows and technology matures, cryptocurrencies are likely to become an increasingly integral part of both individual portfolios and institutional financial strategies.
NIFTY trade ideas

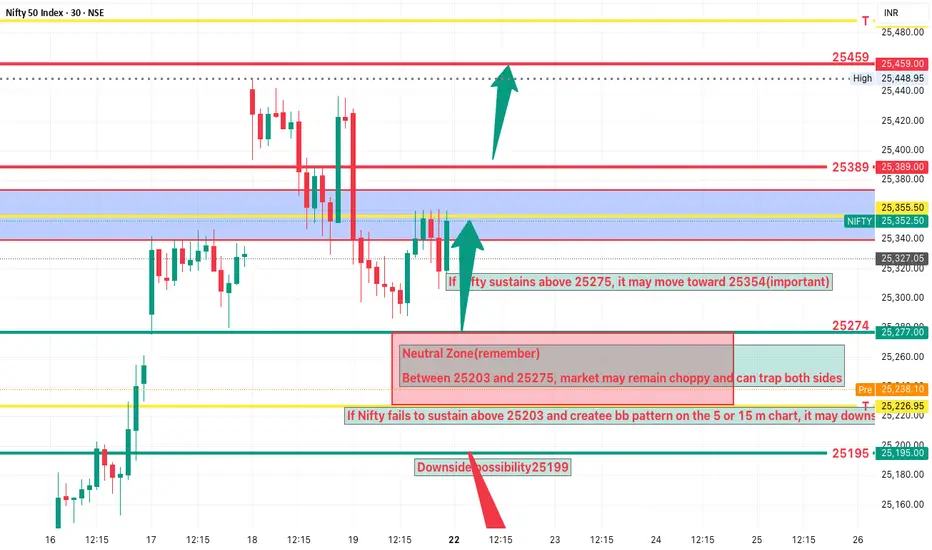
NIFTY Analysis 22 SEPTEMBER, 2025 ,Daily Morning update at 9 amREAD CAREFULLY EVERY WORD
intraday Bearish Setup
If Nifty opens near 25245 and trades below 25203, watch for downside targets at 25155 and 25104.
IT sector weakness can add pressure
Intraday Bullish Setup
If Nifty reclaims and sustains above 25275, upside targets are 25354 and 25389
Sustaining above 25389 may open the next level at 25459
Neutral Zone
Between 25203 and 25275, market may remain choppy and can trap both sides.

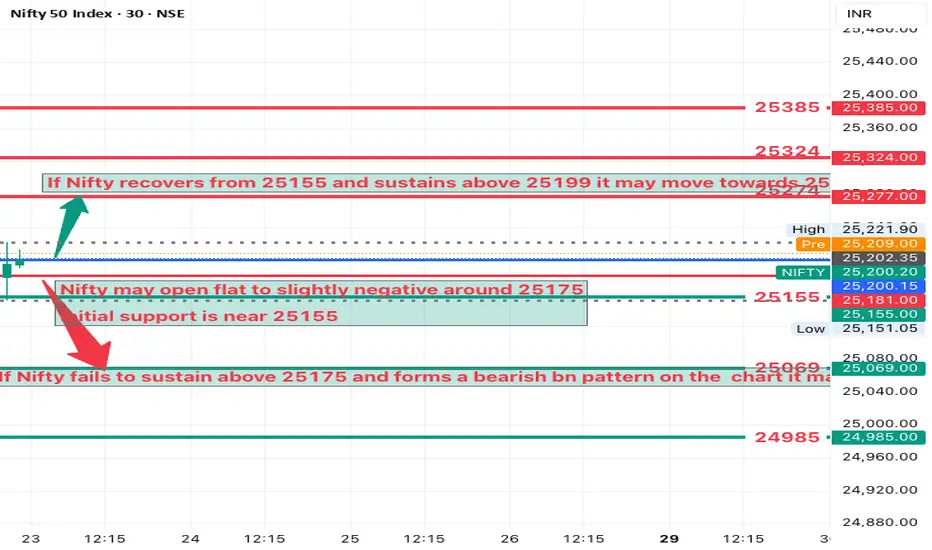
NIFTY Analysis 23 SEPTEMBER, 2025 ,Daily Morning update at 9 amSupport 25155 25069 24985
Resistance 25274 25324 25385
If Nifty holds 25155 and moves above 25199, consider buying
Target: 25274
Stop loss: just below 25155
If Nifty fails to sustain above 25175 and forms a BN pattern on chart, consider selling
Target 25103 then 25065
Stop loss just above 25175
Trade only near support and resistance levels
Watch price action on 5-minute and 15minute charts
gift for you. If Nifty holds above 25199 Buy Calls
If Nifty breaks below 25175 Buy Puts
If Nifty stays between 25155–25199 Avoid or Sell Options with hedging
19 Sep 2025 - Nifty's long stance has given an incredible 448ptsNifty Stance Bullish 🐂
My last post-mortem report was on September 6th, as I was unable to send out the reports last week due to a personal engagement. Meanwhile, nothing significant happened that week, as the long-only stance remains valid.
The last crossover was on September 4th, and from then on, we had only a one-way trend, i.e., long-only. The points in unrealized profits = 448pts. As you know, we book profits/loss when the trend reverses direction, so as per the chart above, we require the yellow line (Fast EMA) to cut the blue line (Slow EMA) for bookings.
As it stands, even if the market falls badly on Monday, the bookings will still come at a profit. Technically, the yellow line widening out from the blue shows an accelerating trend, and if it's narrowing down, it means the trend is fading out.
A lot of macroeconomic news is coming in between that could create a whipsaw in the short term. It is best recommended to ride out the wave with a smaller position until we digest the trustworthy news instead of rumors.
The nearest support levels are 25219, 25003 and 24931. The nearest resistance is 25681. If we reverse the trend, I will let you know via the TradingView minds section. Be sure you are following to get my email or notifications.

Part 2 Ride The Big Moves 1. How Options Work in Practice
Suppose you buy a call option:
Stock XYZ = ₹200.
Call strike = ₹210.
Premium = ₹5.
Expiry = 1 month.
If the stock rises to ₹230 before expiry:
Profit = (230 – 210) – 5 = ₹15 per share.
If the stock stays below ₹210:
Loss = Premium paid = ₹5.
So the risk is limited to the premium, but the profit can be large.
2. Why Do People Trade Options?
Speculation – Traders use options to bet on price movements with limited risk.
Hedging – Investors buy puts to protect their portfolios (like insurance).
Income Generation – Selling options (like covered calls) can generate steady income.
Leverage – Options allow control of large positions with small amounts of money.
3. Option Buyers vs. Option Sellers
Option Buyer
Pays the premium.
Has rights but no obligation.
Risk is limited to the premium.
Profit potential can be high.
Option Seller (Writer)
Receives the premium.
Has an obligation to buy/sell if the buyer exercises.
Risk can be unlimited (in case of naked options).
Profit is limited to the premium received.
4. Strategies in Option Trading
Options are flexible. Traders combine calls and puts in creative ways to form strategies. Some common ones:
Covered Call – Holding a stock and selling a call against it for extra income.
Protective Put – Buying a put option to protect against downside risk in stocks.
Straddle – Buying both a call and a put at the same strike to profit from big moves either way.
Iron Condor – Selling both a call spread and a put spread to profit from low volatility.
Bull Call Spread – Buying one call and selling another at a higher strike to reduce cost.
Each strategy balances risk and reward differently.
5. Risks in Option Trading
While options are powerful, they also carry risks:
Time Decay – Options lose value as expiry approaches.
Volatility Risk – Options are sensitive to changes in volatility.
Liquidity Risk – Some options have low trading volume, making entry/exit difficult.
Unlimited Loss (for sellers) – A naked call seller can face huge losses if stock rises sharply.
Complexity – Misunderstanding option behavior can lead to unexpected losses.
6. Benefits of Option Trading
Flexibility – You can profit in rising, falling, or sideways markets.
Leverage – Control large exposure with small capital.
Hedging – Protect your portfolio against downside risk.
Defined Risk (for buyers) – Maximum loss is limited to the premium.
Income Opportunities – Selling options can generate consistent returns.

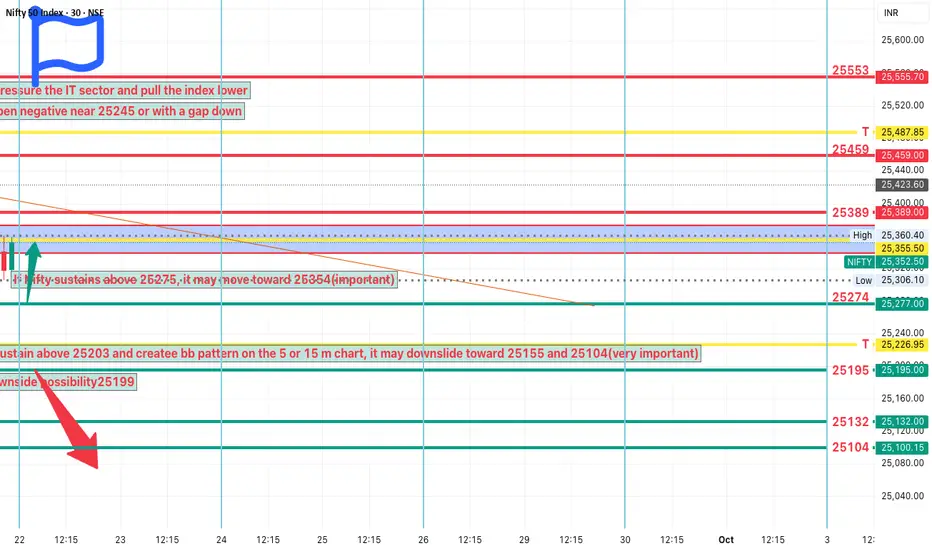
NIFTY Analysis 22 SEPTEMBER, 2025 ,Daily Morning update at 9 am25203–25275 is a no-trade zone, wait for breakout or breakdown confirmation.
If market opens with a gap down near 25245, observe whether it sustains above 25275 for recovery or slips below 25203 for weakness.
intraday Bearish Setup
If Nifty opens near 25245 and trades below 25203, watch for downside targets at 25155 and 25104.
IT sector weakness can add pressure.
Intraday Bullish Setup
If Nifty reclaims and sustains above 25275, upside targets are 25354 and 25389.
Sustaining above 25389 may open the next level at 25459
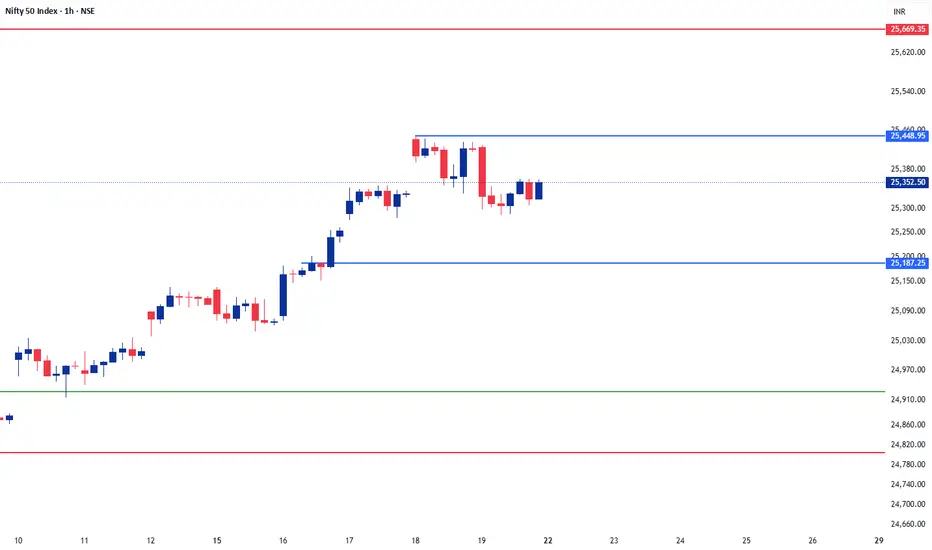
Nifty 1D Time frameCurrent Facts
Current Level: ~25,300–25,310
Trend: Mildly bullish; Nifty is trading above short-term moving averages (20-day & 50-day EMA).
Momentum Indicators:
RSI (14-day): ~60 → positive but not overbought.
MACD: Positive → supports short-term bullish bias.
Price Action: Daily candles show small upper wicks → slight profit-booking near resistance levels.
⚙️ Outlook
Bullish Scenario:
Holding above 25,270 → retest 25,350–25,370 and possibly 25,420–25,450.
Range / Consolidation:
Price oscillates between 25,270 – 25,350 → sideways action expected.
Bearish Scenario:
Close below 25,250 → downside risk toward 25,180–25,200 or lower.
⚠️ Facts
25,300–25,310 acts as a short-term pivot — above it favors bulls, below it favors bears.
Immediate resistance is at 25,350–25,370; breakout here can trigger upside momentum.
Support at 25,250 is crucial; failure to hold may result in deeper correction.
What is Buyback & Why Companies Do It?Hello Traders!
Every now and then, you’ll hear the news, “XYZ company announces share buyback.”
But what exactly is a buyback, and why do companies spend so much money to purchase their own shares? Let’s break it down in simple terms.
1. What is a Buyback?
A buyback (also called share repurchase) happens when a company buys its own shares from the stock market.
This reduces the number of shares available in the market, which can increase the value of the remaining shares.
2. Why Do Companies Do Buybacks?
To Increase Shareholder Value: With fewer shares in circulation, earnings per share (EPS) goes up, often supporting a higher stock price.
Utilize Excess Cash: Instead of keeping large cash reserves idle, companies return value to shareholders by buying back shares.
Signal of Confidence: A buyback is often seen as management’s confidence that the stock is undervalued.
Better Than Dividends (Sometimes): Unlike dividends, buybacks can be more tax-efficient for both the company and investors.
3. Does Buyback Always Mean Positive?
Not necessarily, Sometimes companies use buybacks to artificially boost EPS without real growth. If the business fundamentals are weak, a buyback is just a short-term push and doesn’t solve deeper issues.
Rahul’s Tip:
Don’t buy a stock just because of a buyback announcement. Always check if the company has strong fundamentals, healthy cash flows, and a genuine reason behind the buyback.
Conclusion:
A buyback is a powerful tool, but only when backed by strong business performance.
It can reward long-term shareholders and show management’s faith in the company.
But as smart investors, we should look beyond the headline and judge the real financial health.
By @TraderRahulPal (TradingView Moderator) | More analysis & educational content on my profile!
If this post made buybacks clear for you, like it, share your view in comments, and follow for more simple investing insights!
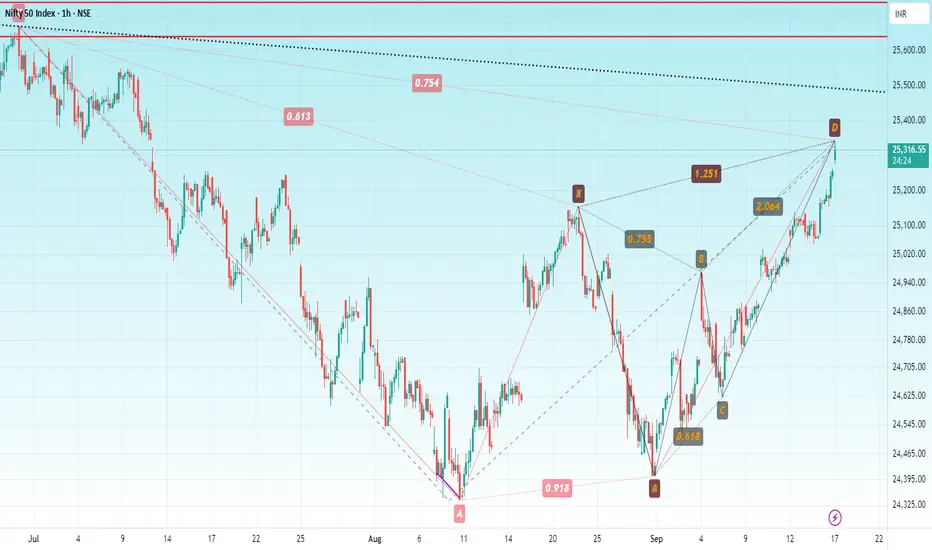
NIFTYHello & welcome to this analysis
On the eve of FOMC meet, the index has today covered the gap down made on July 11th and entered the potential reversal zone (PRZ) 25350 - 25425 of two bearish harmonic patterns - Butterfly (15m) & Gartley (daily).
Reversal confirmation as of now is once it starts giving a 60m close below 25225.
Pattern gets negated above 25525.
All the best
Regards
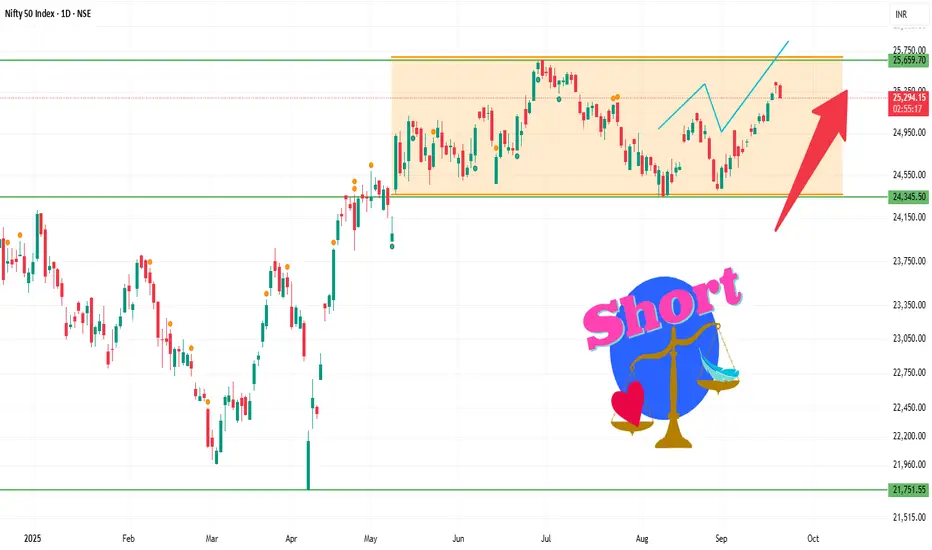
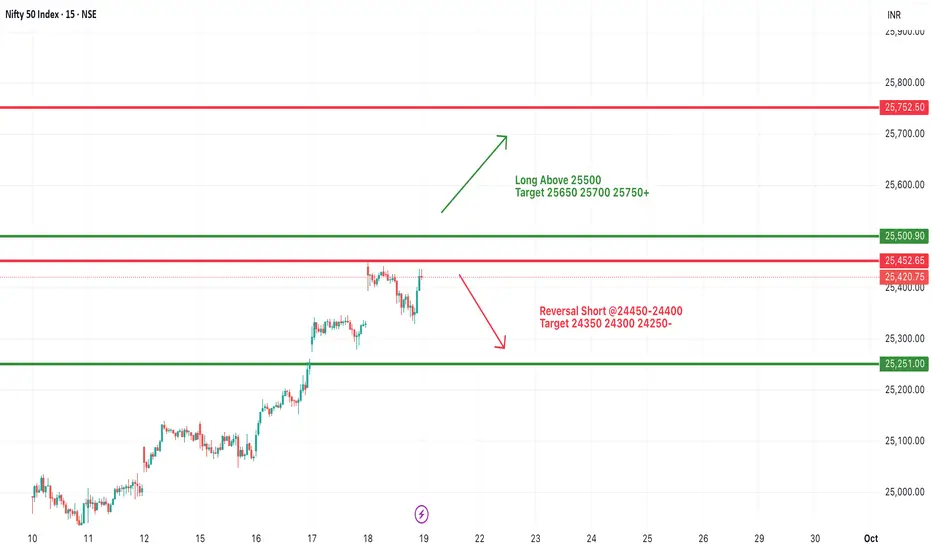
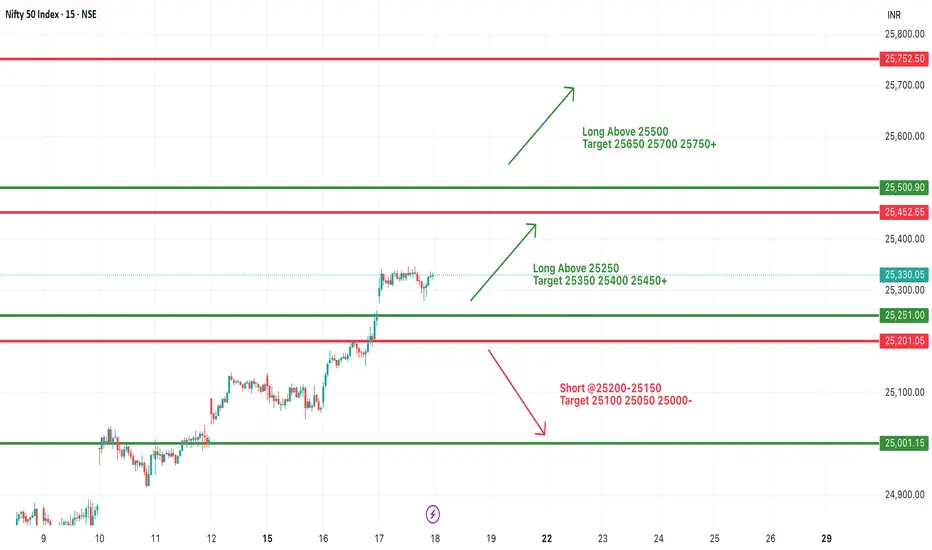
#NIFTY Intraday Support and Resistance Levels - 19/09/2025For Nifty, the index is expected to open flat near the 25,420–25,450 zone. On the upside, sustaining above 25,250 and crossing 25,500 decisively will be crucial. A move above 25,500 can trigger strong bullish momentum, with targets placed at 25,650, 25,700, and 25,750+.
On the downside, the immediate support is seen around 25,250. A break below this may invite selling pressure, pulling the index lower toward 25,100, 25,000, and 24,950-. Additionally, if a reversal occurs from the 25,450–25,500 zone, then a short trade opportunity may open with targets at 24,350, 24,300, and 24,250-.
Overall, Nifty is likely to remain in a range-bound setup with a flat opening. A decisive breakout above 25,500 or a breakdown below 25,250 will dictate the next directional move. Traders should stay cautious near resistance zones and trail positions with strict stop-losses.
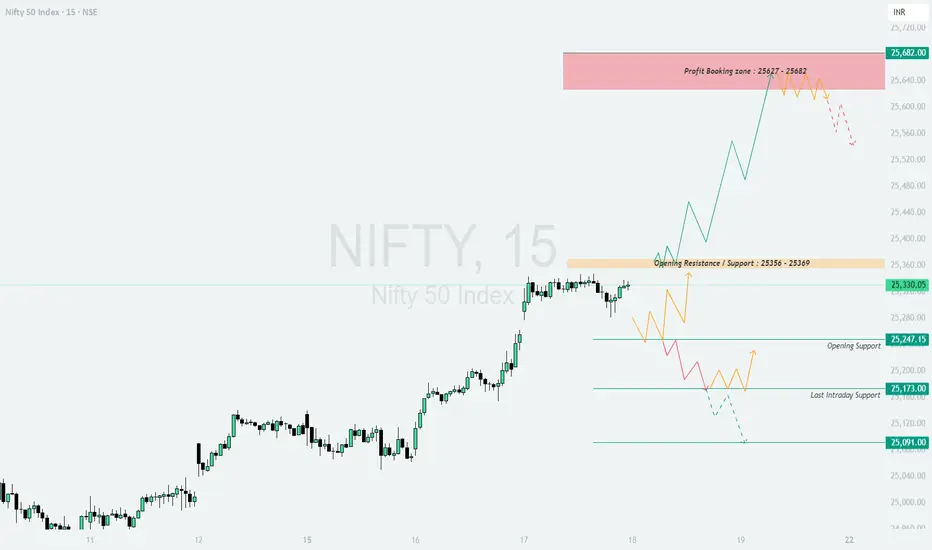
NIFTY : Trading levels and plan for 18-Sep-2025NIFTY TRADING PLAN – 18-Sep-2025
📌 Nifty is consolidating just below the Opening Resistance zone (25,356–25,369). Tomorrow’s opening direction will determine whether the index moves towards the Profit Booking Zone (25,627–25,682) or pulls back towards support levels.
1. Gap-Up Opening (100+ Points Above 25,430) 🚀
If Nifty opens with a strong gap-up above the resistance band (25,356–25,369) and sustains, bullish momentum can continue.
Sustained trade above 25,430 can push the index towards 25,627–25,682 (Profit Booking Zone).
This is a key supply zone – expect some resistance and possible intraday profit booking here.
Aggressive longs should be avoided inside the profit booking zone. Instead, book profits or trail stop losses.
Stop loss for longs should be placed below 25,356 on an hourly close basis.
📌 Educational Note: Gap-ups above resistance often look attractive, but rallies into supply zones carry reversal risk. Be disciplined with trailing stops.
2. Flat Opening (Near 25,330–25,356 Zone) ⚖️
If Nifty opens flat near the current resistance, early moves may remain choppy.
Inside 25,330–25,356, avoid aggressive entries as this is a "no-trade zone."
A breakout above 25,369 can open the path towards 25,627–25,682.
A breakdown below 25,247 will shift sentiment bearish, with downside targets at 25,173 → 25,091.
Patience is key; wait for the market to give clear direction before committing.
📌 Educational Note: Flat openings test traders emotionally. Only trade once the index breaks out of the consolidation range with momentum.
3. Gap-Down Opening (100+ Points Below 25,230) 🔻
If Nifty opens with a gap-down below 25,247, caution is needed as downside momentum may accelerate.
A sustained move below 25,230 can pull the index towards 25,173 (Opening Support).
Further breakdown below 25,173 may drag prices towards 25,091 (Last Intraday Support).
Any pullback towards 25,247 should be watched carefully; rejection here can provide fresh short opportunities.
Stop loss for shorts should be kept above 25,356 on an hourly close basis.
📌 Educational Note: Gap-downs below key supports often invite panic selling, but they can also trap sellers if recovery happens quickly. Always confirm with volume before shorting.
💡 Risk Management Tips for Options Traders
Avoid chasing far OTM options; theta decay accelerates near expiry.
Keep position size small during gap openings, as volatility spikes premiums.
Use stop losses based on hourly candle closes to avoid intraday whipsaws.
Hedge naked positions with spreads to control risk.
Book partial profits at nearby levels instead of holding for the entire move.
📌 Summary & Conclusion
Above 25,369 → Bullish momentum towards 25,627–25,682 (Profit Booking Zone).
Flat near 25,330–25,356 → Wait for breakout or breakdown for clarity.
Below 25,230 → Bearish bias with targets 25,173 → 25,091.
📌 Key Point: First 30 minutes will be decisive tomorrow. Focus on breakouts from resistance/support zones instead of trading inside the chop.
⚠️ Disclaimer: I am not a SEBI-registered analyst. This analysis is shared for educational purposes only. Please do your own research or consult your financial advisor before taking trading decisions.
#NIFTY Intraday Support and Resistance Levels - 22/09/2025Nifty, a slightly gap-down opening is expected near the 25,300–25,350 zone. On the upside, sustaining above 25,250–25,300 can fuel bullish momentum toward 25,350, 25,400, and 25,450+. A breakout above 25,500 will strengthen the uptrend, paving the way for higher levels around 25,650–25,750+.
On the downside, immediate support lies at 25,200–25,150. A breakdown below this zone may invite selling pressure, dragging the index lower toward 25,100, 25,050, and 25,000-. Strong support is placed around 25,000, and a decisive break below that could extend weakness further.
Overall, Nifty is showing range-bound action with a slight bearish bias in early trade, but a sustained move above 25,300 will keep the bullish momentum intact. Traders should wait for confirmation at key levels and manage positions with strict stop-losses.

F&O Watchlist – Stocks with Action👋 Hello Traders!
Welcome to the Daily Options Trade Setup & Watchlist – 12th Sept 2025 🚀
The market is showing strong activity today with fresh long build-ups, surging volumes, and supportive OI data across key F&O names. Volatility remains balanced, creating opportunities for traders to ride the momentum while keeping risks in check.
This watchlist highlights stocks where data and trend are aligning, giving us a clearer picture of market sentiment and possible trading setups.
Let’s explore today’s opportunities 👇
ADANIENT | 11th Sept 2025
Overall Bias: Bullish
Spot Price: ₹2,446.50
Trend: Uptrend
Volatility: Moderate (IV ~24–25%)
Ideal Strategy Mix: Directional Bullish + OTM Convexity + Hedge via PE
________________________________________
✅ Bullish Trade (Naked options as per trend)
ADANIENT 2450 CE LTP @ ₹34.45
Why:
Long Build-up at 2450 CE → OI ↑ 173% with Price ↑ 118% (strong confirmation).
Volume surge 986% → heavy participation.
Delta 0.46 → balance of ITM probability & convexity.
Rising IV (5.9%) → supports premium expansion.
________________________________________
⚠️ Contrarian Trade (Naked options against trend)
ADANIENT 2300 PE LTP @ ₹21.50
Why:
Acts as a downside hedge in case of reversal.
IV 28.7% with IV ↑ 26.8% → room for premium spike.
Delta -0.33 → controlled risk hedge.
Suitable for protection if momentum stalls.
________________________________________
🎯 Strategy Trade (As per trend + OI data)
Bull Call Spread → 2450 CE LTP @ ₹34.45 & 2550 CE LTP @ ₹10.75
Why:
• Aligns with strong bullish OI build-up (2400–2600 CE cluster).
• Captures upside momentum with defined risk.
• Excellent R:R (1:3+) → low cost, high potential reward.
• Short CE hedge (2550) cuts theta decay and risk.
________________________________________
________________________________________
ADANIPORTS | 11th Sept 2025
Overall Bias: Bullish
Spot Price: ~₹1,438 (near 1440 zone)
Trend: Uptrend
Volatility: Moderate (IV ~23–26%)
Ideal Strategy Mix: Directional Bullish + OTM Convexity + Hedge via PE
________________________________________
✅ Bullish Trade (Naked options as per trend)
ADANIPORTS 1440 CE LTP @ ₹13.90
Why:
Long Build-up at 1440 CE → OI ↑ 100.6% with Price ↑ 50.3% (classic long-side confirmation).
Volume surge 524.5% → strong participation.
Delta 0.39 → sweet spot between ITM probability & convexity.
IV rising 20.7% → supportive of premium expansion.
________________________________________
⚠️ Contrarian Trade (Naked options against trend)
ADANIPORTS 1400 CE LTP @ ₹27.90 (used here as hedge/play on exhaustion)
Why:
Higher ITM CE with Delta 0.51 → limited convexity, may underperform if momentum slows.
OI ↑ only 12.3% → weaker build-up compared to mid-OTM strikes.
IV 23.0% (low side) → less premium expansion potential.
Can act as a contrarian hedge if market consolidates below 1440.
________________________________________
🎯 Strategy Trade (As per trend + OI data)
Bull Call Spread → ADANIPORTS 1440 CE LTP @ ₹13.90 & 1500 CE LTP @ ₹4.95
Why:
• Strong long build-ups across 1420–1460 strikes → confirms directional bias.
• Captures upside momentum with defined risk using OTM convexity (1500 CE).
• Excellent R:R (≈ 1:2+) → low debit, higher potential payoff.
• Short OTM CE (1500) reduces theta decay and caps risk.
________________________________________
________________________________________
AUROPHARMA | 11th Sept 2025
Overall Bias: Bullish
Spot Price: ~₹1,118 (near 1120 zone)
Trend: Uptrend
Volatility: Rich (IV ~30–32%)
Ideal Strategy Mix: Bullish Directional + Debit Spreads (IV hedging) + Convexity via OTM Calls
________________________________________
✅ Bullish Trade (Naked options as per trend)
AUROPHARMA 1140 CE LTP @ ₹18.95
Why:
Long Build-up → Price ↑ 351% with OI ↑ 280% (strong long confirmation).
Volume surge 1792% → very active participation.
Delta 0.40 → sweet convexity with good ITM odds.
IV rising 6.2% → supports premium expansion.
________________________________________
⚠️ Contrarian Trade (Naked options against trend)
AUROPHARMA 1060 CE LTP @ ₹64.25 (deep ITM hedge / slowdown risk)
Why:
Short covering at 1060 CE (OI ↓ 15.8%) → weaker continuation if fresh longs don’t add.
Higher ITM delta (0.74) → less convexity, less reward-to-risk.
IV rich (31.6%) → premiums already expensive.
Could underperform if price momentum cools off near resistance zones.
________________________________________
🎯 Strategy Trade (As per trend + OI data)
Bull Call Spread → AUROPHARMA 1120 CE LTP @ ₹26.65 & 1160 CE LTP @ ₹13.10
Why:
• Strong long build-ups between 1120–1160 strike cluster confirm bullish continuation.
• Captures upside momentum with limited debit exposure.
• IV ~30+ → spreads preferred over naked calls (reduces risk of IV crush).
• Good convexity → balance of ITM probability and upside leverage.
________________________________________
________________________________________
HAL | 11th Sept 2025
Overall Bias: Bullish
Spot Price: ~₹4,650 (near 4600–4700 zone)
Trend: Uptrend
Volatility: Moderate (IV ~25–28%)
Ideal Strategy Mix: Directional Bullish + OTM Convexity + Debit Spreads for IV balance
________________________________________
✅ Bullish Trade (Naked options as per trend)
HAL 4800 CE LTP @ ₹36.10
Why:
Long Build-up → Price ↑ 16.8% with OI ↑ 7% (fresh long confirmation).
Volume surge 72.5% → active participation.
Delta 0.34 → balance of convexity & ITM probability.
IV 25.7% → stable with upside potential.
________________________________________
⚠️ Contrarian Trade (Naked options against trend)
HAL 4500 CE LTP @ ₹158.55 (short covering driven, contrarian hedge)
Why:
Short covering at 4500 CE → OI ↓ 13.7% while Price ↑ 12.8%.
Delta 0.61 → deeper ITM, lower convexity.
Volume dropped 56% → thinner liquidity, size should be reduced.
Better suited as hedge / risk balancer in case momentum stalls.
________________________________________
🎯 Strategy Trade (As per trend + OI data)
Bull Call Spread → HAL 4800 CE LTP @ ₹36.10 & 4900 CE LTP @ ₹21.00
Why:
• OI build-up across 4700–4900 CE cluster confirms bullish continuation.
• Debit spread reduces IV risk (IV ~25–27%) and limits loss.
• Defined-risk setup with convexity at 4900 CE.
• Cleaner R:R profile compared to naked long calls.
________________________________________
________________________________________
TCS | 11th Sept 2025
Overall Bias: Bullish
Spot Price: ~₹3,135 (near 3140 zone)
Trend: Uptrend
Volatility: Moderate (IV ~17–19%)
Ideal Strategy Mix: Directional Bullish + OTM Convexity + Debit Spread to balance low IV
________________________________________
✅ Bullish Trade (Naked options as per trend)
TCS 3200 CE LTP @ ₹25.05
Why:
Long Build-up → Price ↑ 9.2% with OI ↑ 7.9% (long confirmation).
IV 17.9% → moderate, stable for option buying.
Delta 0.36 → sweet spot of convexity & ITM odds.
Fits directional bullish bias near resistance breakouts.
________________________________________
⚠️ Contrarian Trade (Naked options against trend)
TCS 3100 CE LTP @ ₹67.85 (short covering driven, weaker momentum trade)
Why:
Short covering at 3100 CE → OI ↓ 4% while Price ↑ 6.1%.
Volume dropped 72.5% → thin liquidity, size down.
IV 17.2% easing -5.3% → weaker premium expansion.
Higher ITM delta (0.59) → less convexity, limited upside gearing.
________________________________________
🎯 Strategy Trade (As per trend + OI data)
Bull Call Spread → TCS 3200 CE LTP @ ₹25.05 & 3300 CE LTP @ ₹8.25
Why:
• Strong long build-ups in 3140–3200 CE cluster confirm bullish continuation.
• Low IV environment (17–19%) → debit spreads attractive.
• Defined-risk setup with convexity via OTM CE (3300).
• Good balance of premium outlay vs reward with capped downside.
________________________________________
________________________________________
📘 My Trading Setup Rules
Avoid Gap Plays → Check pre-open price action to avoid trades influenced by gap-ups/gap-downs.
Breakout Entry Only → Enter trades only if price breaks previous day’s High (for bullish trades) or Low (for bearish trades).
Watch Volume for Confirmation → Monitor volume closely. No volume = No trade.
Enter on Strong Candle + Volume → Execute the trade only if a strong candle appears with increasing volume in the direction of the trade.
Defined Risk:Reward Only → Take trades only if R:R is favorable (ideally ≥ 1:2).
Premium Disclaimer → Option premiums shown are based on EOD prices — real-time premiums may vary during execution.
Time Frame Preference → Trade with your preferred time frame — this strategy works across intraday or positional setups.
⚠️ Disclaimer – Please Read Carefully
The information shared here is meant purely for learning and awareness. It is not a buy or sell recommendation and should not be taken as investment advice. I am not a SEBI-registered investment advisor, and all views expressed are based on personal study, chart patterns, and publicly available market data.
Trading — whether in stocks or options — carries risk. Markets can move unexpectedly, and losses can sometimes exceed the money you have invested. Past performance or past setups do not guarantee future results.
If you are a beginner, treat this as a guide to understand how the market works — practice on paper trades before risking real money. If you are experienced, always assess your own risk, position sizing, and strategy suitability before entering trades.
Consult a SEBI-registered financial advisor before making any real trading decision. By engaging with this content, you acknowledge full responsibility for your trades and investments.
💬 Found this useful?
🔼 Give this post a Boost to help more traders discover clean, structured learning.
✍️ Drop your thoughts, questions, or setups in the comments — let’s grow together!
🔁 Share with fellow traders and beginners to spread awareness.
👉 “If you liked this breakdown, follow for more clean, structured setups with discipline at the core.”
🚀 Stay Calm. Stay Clean. Trade With Patience.
Trade Smart | Learn Zones | Be Self-Reliant 📊
Nifty is ready for 26000We are expecting Nifty to reverse from the important demand zone of 25050.
After the reversal, we can expect Nifty to reach above 26000. RSI is also indicating the reversal signal on the 30-minute timeframe.

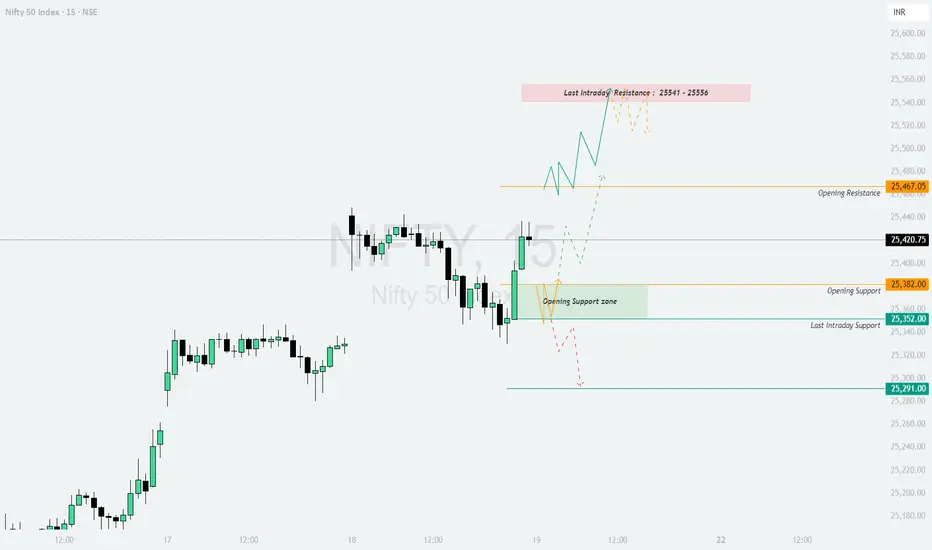
NIFTY : Trading levels and Plan for 19-Sep-2025NIFTY TRADING PLAN – 19-Sep-2025
📌 Key Levels from the Chart:
Opening Resistance: 25,467
Last Intraday Resistance: 25,541 – 25,556
Opening Support: 25,382
Last Intraday Support: 25,352
Major Support Zone: 25,291
🚀 Gap-Up Opening (100+ points above previous close)
If Nifty opens above 25,520–25,540, it directly enters the Last Intraday Resistance Zone (25,541–25,556) . This zone will be a key battleground for bulls and bears. Sustaining above this resistance could open the path towards 25,600+ levels.
📌 Trading Approach:
Look for long entries only if price sustains above 25,556, targeting 25,600–25,650.
Keep a strict stop-loss below 25,467 (Opening Resistance).
If rejection occurs near resistance, a pullback towards 25,467–25,420 is possible. In that case, option traders can shift to short-term put buying.
📉 Flat Opening (within ±100 points of 25,420)
A flat opening near the previous close would keep Nifty between Opening Resistance (25,467) and Opening Support (25,382). This means consolidation and indecision in the early session.
📌 Trading Approach:
Avoid rushing into trades in the first 30 minutes. Let the market choose direction.
If the index breaks above 25,467 with volume, ride the trend towards 25,541–25,556.
If it fails and slips below 25,382, expect a dip towards 25,352 and possibly 25,291.
🔻 Gap-Down Opening (100+ points below previous close)
If Nifty opens below 25,320–25,300, it enters a weak territory, testing Last Intraday Support (25,352) and moving towards 25,291.
📌 Trading Approach:
If support at 25,291 holds, a bounce back towards 25,352–25,382 is likely, providing a short-term buying opportunity.
If 25,291 breaks decisively, further downside towards 25,200–25,150 cannot be ruled out. In this case, short positions with strict SL above 25,352 are safer.
🛡️ Risk Management Tips for Options Traders
Avoid aggressive buying in resistance zones; wait for confirmation candles.
Use spreads (Bull Call / Bear Put) instead of naked options in volatile markets.
Risk per trade should not exceed 2% of capital.
Trail stop-loss once trade moves in your favor.
Exit part positions at first target; let the rest ride with stop-loss shifted to cost.
📌 Summary & Conclusion
Above 25,556, momentum may stretch towards 25,600–25,650.
A flat opening requires patience; breakout above 25,467 or breakdown below 25,382 will give direction.
Below 25,291, weakness can intensify towards 25,200.
Stay disciplined, respect levels, and follow strict risk management to protect capital.
⚠️ Disclaimer
I am not a SEBI registered analyst . This trading plan is prepared purely for educational purposes. Please do your own research or consult a financial advisor before trading.
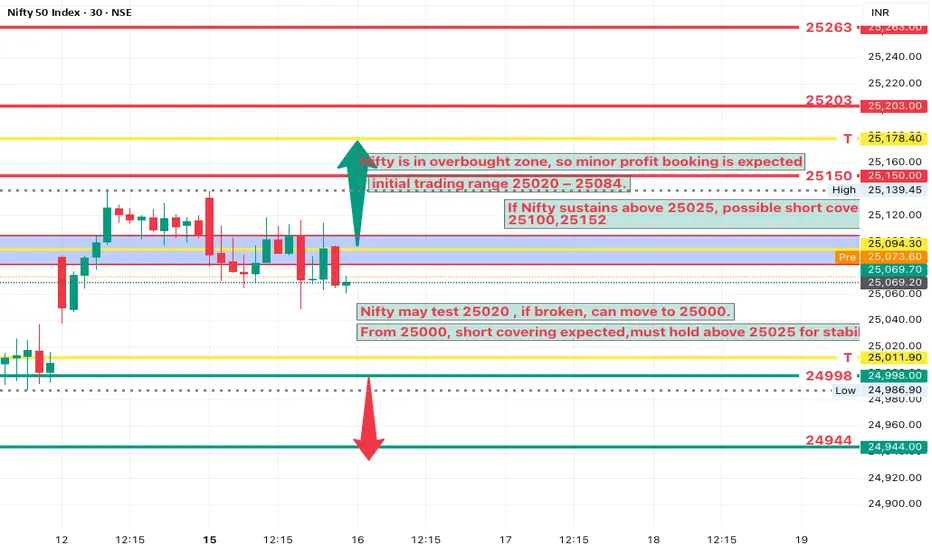
NIFTY Analysis 16 SEPTEMBER, 2025 ,Daily Morning update at 9 amNMifty is in overbought zone so expect profit booking
Initial range is between 25020 and 25085
Opening may POSSIBLEE near 25059
If Nifty goes down to 25023 and holds above 25020 then it can move to 25100 and 25150
If Nifty falls to 25000 and holds above 25000 then short covering can take it back to 25020 and 25105
If Nifty breaks below 25000 ,WATCH BB BAND on 5 minute chart then it may slip to 24943
Support levels for today are 25498 and 24943
Resistance levels for today are 25150 and 25203
#NIFTY Intraday Support and Resistance Levels - 18/09/2025For Nifty, the index is expected to open on a strong note near the 25,450 level, indicating a clear gap-up start. A sustained move above the key zone of 25,250 will keep the momentum positive and may drive the index higher toward 25,350, 25,400, and 25,450+. If it manages to cross and hold above the 25,500 mark, further upside extensions toward 25,650–25,750+ are likely, strengthening the bullish sentiment.
On the downside, immediate support is placed around 25,200–25,150. A break below this range could trigger selling pressure, dragging the index back toward 25,100 and 25,000-. This zone will act as a crucial short-term support to watch out for.
Overall, with a gap-up opening near 25,450, the sentiment remains bullish. However, profit booking around resistance levels cannot be ruled out. Traders should ride the momentum with strict stop-losses while trailing profits as the index approaches higher targets.
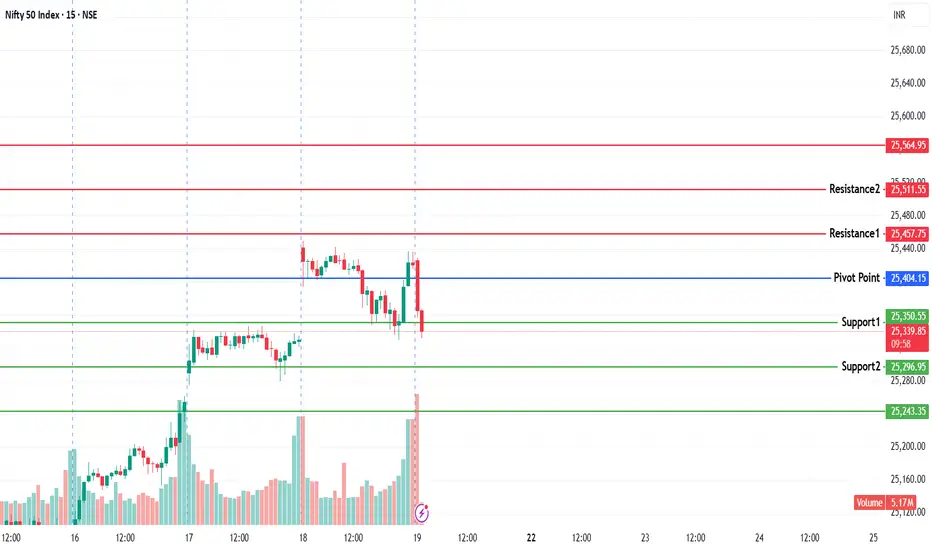
NIFTY KEY LEVELS FOR 19.09.2025NIFTY KEY LEVELS FOR 19.09.2025
RTF: 3 Minutes
If the candle stays above the pivot point, it is considered a bullish bias; if it remains below, it indicates a bearish bias. Price may reverse near Resistance 1 or Support 1. If it moves further, the next potential reversal zone is near Resistance 2 or Support 2. If these levels are also broken, we can expect the trend.
When a support or resistance level is broken, it often reverses its role; a broken resistance becomes the new support, and a broken support becomes the new resistance.
If the range(R2-S2) is narrow, the market may become volatile or trend strongly. If the range is wide, the market is more likely to remain sideways
please like and share my idea if you find it helpful
📢 Disclaimer
I am not a SEBI-registered financial adviser.
The information, views, and ideas shared here are purely for educational and informational purposes only. They are not intended as investment advice or a recommendation to buy, sell, or hold any financial instruments.
Please consult with your SEBI-registered financial advisor before making any trading or investment decisions.
Trading and investing in the stock market involves risk, and you should do your own research and analysis. You are solely responsible for any decisions made based on this research.
Nifty Weak 25K - 24,800 wont be a Surprise Recap:
💡 View shared on 18th Sep 2025:
Trend is positive & any dip is a buy opportunity.
✅ Strength above 25,430
❌ Weakness below 25,350
⚠️ Cautions near 25,515 - 25650
Actual on 19th Sep 2025
OHLC
25,410 🎯 Strength only above 25,430.00
25,428 🎯 Strength only above 25,430.00
25,286
25,327 🎯 Given Support was 25,350.00
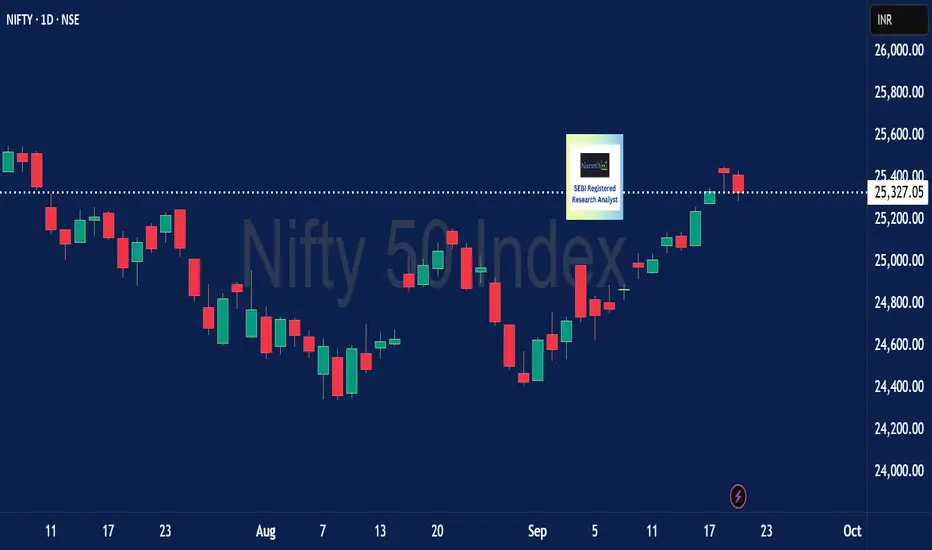
22/09/2025 Nifty View
📌 Last Close: 25,327
🔻 Support: 25,254 - 25,204
🔺 Resistance: 25,340 - 25,426
💡 View:
Trend is seems negative & Gap down opening wont be a surprise.
✅ Strength above 25,460
❌ Weakness below 25,200
⚠️ Stay Cautions in LONG & SHORT - Keep churning to avoid Volatility
👉 Do you find these daily views useful and want to receive them regularly?
If yes, show 👍
Your support motivates us to share more
💡 Liked the idea?
Then don’t forget to Boost 🚀 it!
For more insights & trade ideas,
📲 Visit my profile and hit Follow
Warm regards,
Naresh G
SEBI Registered Research Analyst
💬 Comment below if you want me to analyse any stock for you 🔍
Nifty 27000+ Target Maintain Long Here’s a clear **overview of Nifty 50 (NSE Index)** for you:
---
## 📌 What is Nifty 50?
* The **Nifty 50** is the benchmark stock market index of the **National Stock Exchange (NSE) of India**.
* It represents the **top 50 large-cap companies** across major sectors of the Indian economy.
* Managed and owned by **NSE Indices Limited (a subsidiary of NSE)**.
---
## 📊 Key Facts
* **Base Year:** 1995
* **Base Value:** 1000
* **Base Date:** November 3, 1995
* **Calculation Method:** Free-float market capitalization weighted
* **Constituents:** 50 companies from **14 major sectors** (Banking, IT, Oil & Gas, Pharma, FMCG, Automobiles, Metals, etc.)
* **Weightage:** Banking & Financial Services + IT + Energy = \~65% of index weight.
---
## 📈 Importance of Nifty
1. **Market Barometer:** Reflects overall performance of the Indian stock market.
2. **Investment Benchmark:** Mutual funds, ETFs, and PMS compare their performance with Nifty.
3. **Derivatives Trading:** Futures and Options (F\&O) on Nifty are highly liquid and widely traded.
4. **Passive Investment:** Nifty ETFs allow investors to invest directly in India’s top 50 companies.
---
## 🔍 Current Trend (2025)
* Nifty has been in a **long-term uptrend**, hitting new highs over the past year.
* Short-term corrections are seen due to **global market volatility, Fed rate policies, and crude oil fluctuations**.
* Support zones are around **25,000–25,150**, while resistance is around **25,800–26,000** (as per latest technical analysis).
---
## 📌 Sector Contribution (Approx.)
* **Financial Services:** \~36%
* **IT:** \~14%
* **Oil, Gas & Energy:** \~12%
* **Consumer Goods (FMCG):** \~10%
* **Automobiles, Pharma, Metals, Cement, etc.:** Balance
---
✅ In short: **Nifty 50 = India’s economic growth mirror**, tracking the biggest and most liquid companies, used by traders, investors, and institutions for market direction.
---

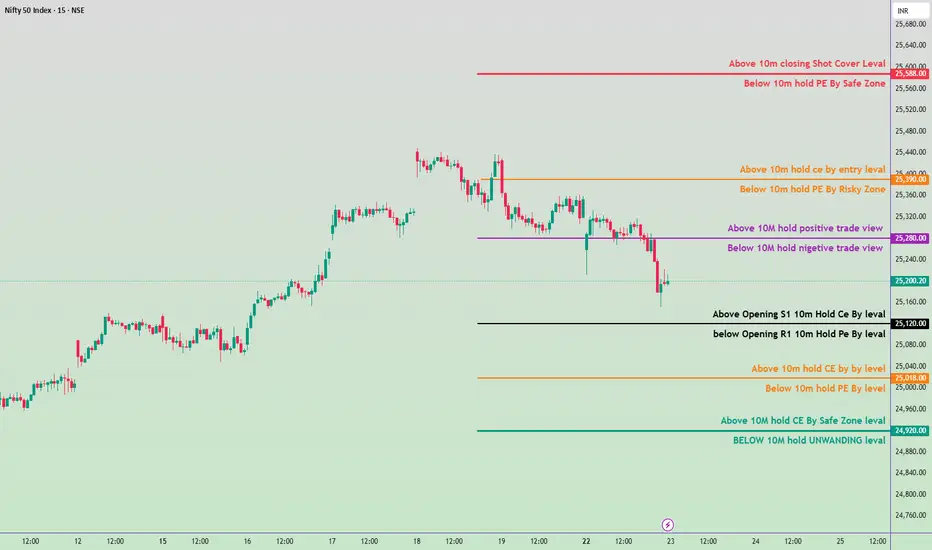
23 sep 2025 Nifty 50 Index with tomorrow’s key levels🔑 Key Levels
25,680 → Above 10m closing Short Cover Level
Below 10m hold PE by Safe Zone
25,390 → Above 10m hold CE by Entry Level
Below 10m hold PE by Risky Zone
25,280 → Above 10m hold Positive Trade View
Below 10m hold Negative Trade View
25,120 → Above Opening S1 10m Hold CE by Level
Below Opening R1 10m Hold PE by Level
25,008 → Above 10m hold CE by Level
Below 10m hold PE by Level
24,920 → Above 10m hold CE by Safe Zone Level
Below 10m hold Unwinding Level
“Stay tuned for more learning – like & follow now!”
#Nifty Weekly Analysis 22-09-25 to 26-09-25#Nifty Weekly Analysis 22-09-25 to 26-09-25
25200-25500 is the sideways range for nifty next week.
If Nifty trades below 24200, more downside possible and targets are 25080/24900.
If nifty sustains above 25500, more upside possible and targets are 25650/25780.
View: Sideways to Downside.