Pre-market Analysis Nifty Bank Nifty 30 June 2023Market Recap
Nifty advanced 0.82% to close at 18,972.10
Bank Nifty advanced 0.47% to close at 44,327.80
India VIX advanced 1.02% to close at 10.89
NIFTY1! trade ideas

Nifty Future Levels 30th June 2023Observe where the day opens tomorrow. Price action should be watched, and a decision taken accordingly.
Will try and give some live market updates.
Keep following to understand the significance of these lines drawn and how and why these lines are very important.
Please go through the previous charts and check the price action and how these lines responded vis a vis the days open

SGX Nifty Daily Chart CUP Pattern breakoutSGX Nifty Daily Chart CUP Pattern breakout suggest 2400 points upmove on Nifty in next 6-8 Months
LTP 19125
SL 18600
Targets 21400+
Timeframe 6-8 Months.
Happy Investing to my friends & Followers.

SGX Nifty Hourly Breakout from CUP pattern ... 19100 TargetsSGX Nifty shows breakout from the Hourly CUP Pattern with Target coming as 19100 by next Weekend.
LTP 18885
Targets 19100
Buy all dips for 1 week with SL at 18750.
Happy Trading to my friends & followers.

Going Long With Nifty June FutureNifty June Future is currently trading at 18808, I am going long based on my analysis. My target is 19022.70 by 29-06-2023.

Nifty G1 Bullish Nenstar Harmonic PatternNifty G1 Bullish Nenstar Harmonic Pattern
.
.
.
.
PRZ 1 - 18690.40
PRZ 3 - 18685.20
PRZ 3 - 18677.95
.
.
Stoploss - 18656.75

Pre-market Analysis Nifty Bank Nifty 28 June 2023Market Recap
Nifty advanced 0.68% to close at 18,817.40
Bank Nifty advanced 1.10% to close at 44,121.50
India VIX declined 5.42% to close at 10.78

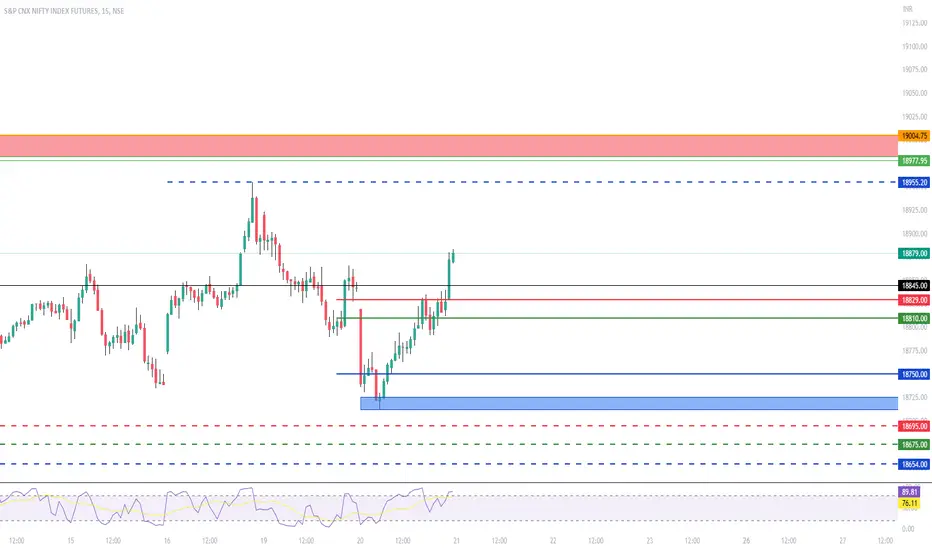
Nifty Futures 28th June 2023Observe where the day opens tomorrow. Price action should be watched, and a decision taken accordingly.
Will try and give some live market updates.
Keep following to understand the significance of these lines drawn and how and why these lines are very important.
Please go through the previous charts and check the price action and how these lines responded vis a vis the days open

27-Jun Nifty price actionNifty has many price action concepts today such as trading range bound, breaking resistance, then trendline break with high low high high structure and resistance turning into support finally.

NIFTY FUTURES 27TH JUNE 2023Let's see how the day opens tomorrow. Price action should be watched, and a decision taken accordingly.
Will try and give some live market updates.
Keep following to understand the significance of these lines drawn and how and why these lines are very important.
Please go through the previous charts and check the price action and how these lines responded vis a vis the days open


5 Week Rate of Change5 Week Rate of Change turned up.
Turned above zero line on week ended 22/06/2023
Since then it is above the zero line.
In the supply zone created by the earlier peak of 19031.
The supply zone is 19031-18557.
For last 4 weeks, SGX NIFTY in the supply zone.
Support of 18500 critical.
A fall and close below 18500 with bearish candle
can lead to retracement/correction of the rise 16899
to 18975.
Retracement levels as shown in the chart will come into
contention once breakodwn and close below 18490 is
witnessed.
Subsequently retracement of 18186-17939-17693 to be tested.
Rate of Change of 5 weeks can turn down as it is falling.
Breakdown below 18490 can lead to Rate of Change of 5 weeks
to move below zero confirming the near term to short term
correction/retracement.
As long as it is above 18490, volatility/sideways corrective
behaviour can be witnessed.
Essentially a breakout and close above 19031
with bullish candle will help the market to extend
the long term up.
Volatility and correction are intermdiate to short term.
Some time can extend to medium term.
It would depend on how traders perceive
the respective time frames and the defination
of the same.

SGX observational ViewA correction of the rise from C to D for E is likely.
Retracement of the rise from 16899 to 18975
are placed at 18490(23.6%) and 18490(38.2%).
Ideally must hold these levels.
If it does not then next retracement levels
50% 18186 and 61.8% 17693.
The correction if extend to either of these levels
will depends on correction momentum.
Higher bottom will be created at either of the above retracement.
Once swing higher bottom is witnesssed then expect
rise to resume with breakout above the recent high to
extend up to 20428(23.6%) fib-projection
and subsequently to 61.8% 24687.

Nifty Futures 26th June 2023It would be very interesting to observe what happens when
1. Price opens within the range marked of Red, Blue and Green Lines.
2. Price opens below / above the range but within the range of the previous day
3. When there is a Gap up and Gap down opening.
If You are studying the charts in lower Time frames and observing price action, Let me know in comments your observations on the points 1,2 and 3 mentioned above.
Keep Following for LIVE UPDATES

Trendline break targets on 75min TFIf trendline break is confirmed on Monday, targets on downside as follows

When to adjust Options - 5 Guidelines to stop your lossesIn this video, I discuss 5 Options selling guidelines which you can use to exit your option trades when they go wrong.
Selling options come with the risk of unlimited losses . That's why, the main aim of adjusting options is to put a cap to the losses , reassess the situation and increase profitability.
Follow @piyushrawtani for more!
Cheers =)

Pre-market Analysis Nifty Bank Nifty 23 June 2023Market Recap
Nifty declined 0.45% to close at 18,771.25
Bank Nifty declined 0.31% to close at 43,724.85
India VIX advanced 2.26% to close at 11.55

Nifty Futures 23rd June 2023It would be very interesting to observe what happens when
1. Price opens within the range marked of Red, Blue and Green Lines.
2. Price opens below / above the range but within the range of the previous day
3. When there is a Gap up and Gap down opening.
If You are studying the charts in lower Time frames and observing price action, Let me know in comments your observations on the points 1,2 and 3 mentioned above.
Keep Following for LIVE UPDATES

Nifty Futures 22nd June 2023 EXPIRYIt would be very interesting to observe what happens when
1. Price opens within the range marked of Red, Blue and Green Lines.
2. Price opens below / above the range but within the range of the previous day
3. When there is a Gap up and Gap down opening.
If You are studying the charts in lower Time frames and observing price action, Let me know in comments your observations on the points 1,2 and 3 mentioned above.
Keep Following for LIVE UPDATES

Pre-market Analysis Nifty Bank Nifty 22 June 2023Market Recap
Nifty advanced 0.21% to close at 18,856.85
Bank Nifty advanced 0.21% to close at 43,859.20
India VIX advanced 1.44% to close at 11.29

Pre-market Analysis Nifty Bank Nifty 21 June 2023Market Recap
Nifty advanced 0.33% to close at 18,816.70
Bank Nifty advanced 0.30% to close at 43,766.50
India VIX declined 0.82% to close at 11.13

Nifty confluence zoneNifty today bounced from a support zone which was earlier a resistance. The same also has a trendline support.

Nifty Futures 22nd June 2023Let's see how the day opens tomorrow. Price action should be watched, and a decision taken accordingly.
Will try and give some live market updates.
Keep following to understand the significance of these lines drawn and how and why these lines are very important.
Please go through the previous charts and check the price action and how these lines responded vis a vis the days open