Understanding the Fundamental MarketCore Principles of the Fundamental Market
Intrinsic Value Assessment:
The central idea in the fundamental market is that every asset has an intrinsic or “true” value. Investors compare this intrinsic value with the current market price to determine whether the asset is undervalued, fairly valued, o
Related futures
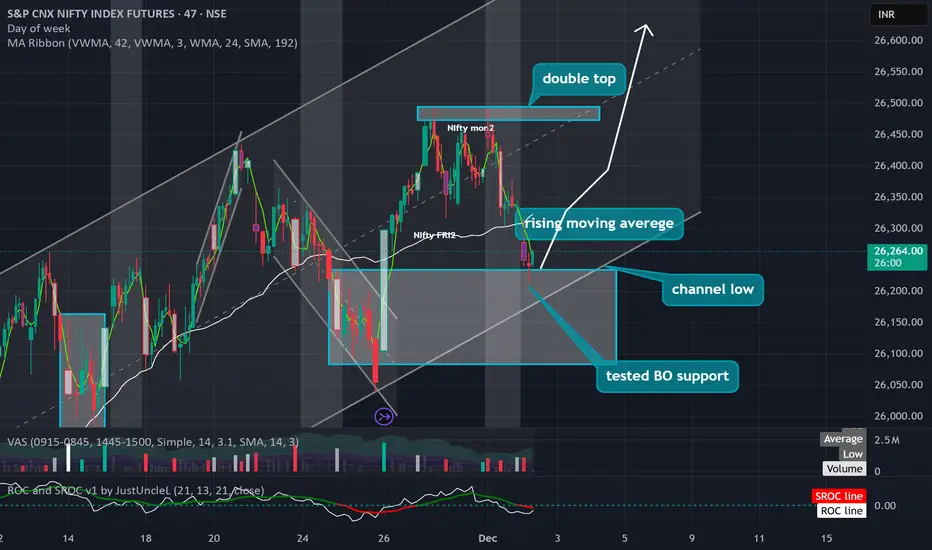
Break the top this time# NIFTY FUTURES - High Probability Channel Bounce Setup 📈
## Current Price: 26,252.70 (+11.40, +0.04%)
---
## Technical Setup Summary
**BULLISH BIAS** - Multiple confluence factors suggesting a move toward channel high
---
## Key Observations
### 1. **Channel Structure**
- Price currently at
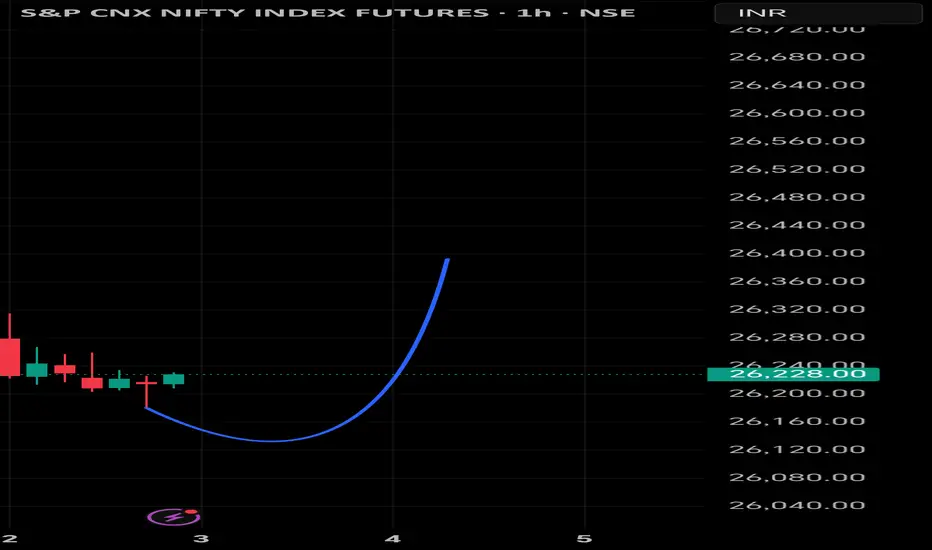
bullish trade in nifty anticipating this buy trade in nifty from mid reversal level .
there was gap on this nifty chart for 26th Nov, Gap filled and we had mid reversal level there .. so expecting a price to turn bullish from here .

Trade deal on Monday ????# NIFTY FUTURES - Clean Breakout & Successful Retest 🎯
## Key Observations:
**Price Action:**
- Strong breakout from the consolidation range (marked in blue)
- Successfully retested the breakout level around 26,000
- Currently trading at 26,170.50, holding well above the breakout zone
**Technical

Nifty BUY at current level - BULLISHI have indicated in my earlier post for a Bullish breakout and hinte to exit at 26000 near Diwali.
Now again, I am for BULLISH call.
Reason for my Bullish call is given below:
Again, Despite 1H (1) Extreme, 4 (1W) still Up. So the trend has not changed.It is Up
TARGET Upside - 4Hour Fisher Top.
B

Nifty Future View Nifty Future take Support Around 26190 to 26150 Make Up Move
26350 26500
View Only for study purpose
Part 6 Learn Institutional Trading Cash-Secured Put – Best for Buying Stocks at Lower Price
This is the safest way to use options when you want to accumulate stocks at a discount.
How it works
You set aside cash.
You sell a put option at a lower strike price.
If the stock falls below strike, you get the shares at a discount.
If

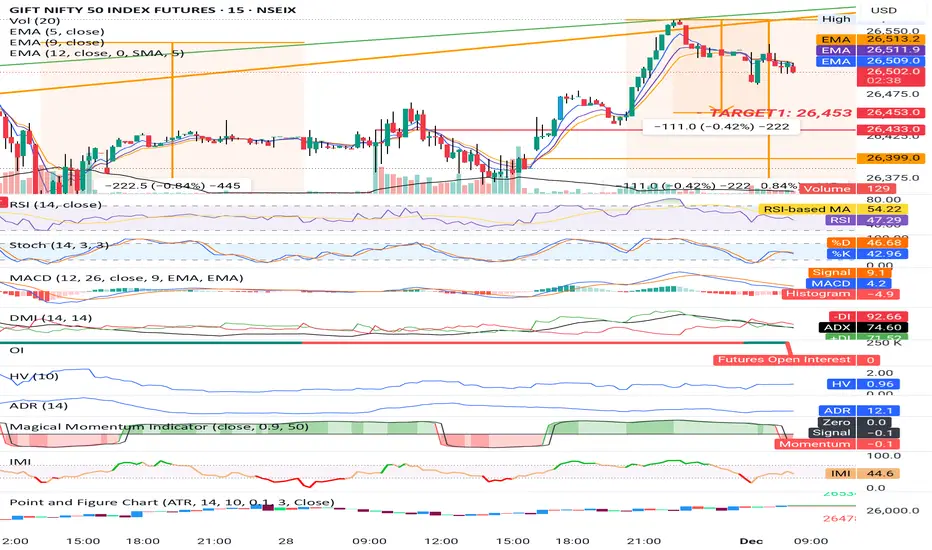
GIFT NIFTYGIFT NIFTY is moving at high but with very less volume. Which shows the correction in market. Gift nifty is showing bearish in short term view with target 26,400 and strong support atbsame level, if support was not taken we can expect further downside with a target of 26,120. If Gift Nifty took sup
"D" Day !!!!!
**📊 NIFTY FUTURES - 3-Day Composite Profile Analysis**
**Current Setup:**
- Classic D-shaped composite profile showing strong initiative buying over last 3 days
- Price currently balanced at Value Area High (~26,003)
- POC: 25,955 | VAH: 26,003 | VAL: 25,880
**Potential Scenario - Fake Breakdown

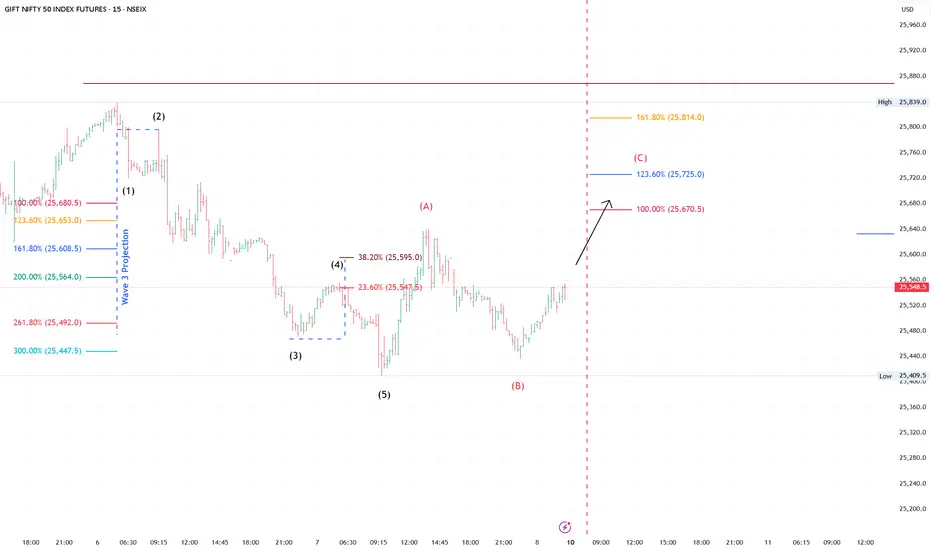
SGX Nifty – Elliott Wave Breakdown & Short Setup (15-Min Chart)SGX Nifty is on its way to complete Wave C correction around 100% - 123% range at level of 25,670 to 25,725.
Thereafter SGX Nifty may turn to Sideways to Bearish...
Plan accordingly.
See all ideas
Summarizing what the indicators are suggesting.
Neutral
SellBuy
Strong sellStrong buy
Strong sellSellNeutralBuyStrong buy
Neutral
SellBuy
Strong sellStrong buy
Strong sellSellNeutralBuyStrong buy
Neutral
SellBuy
Strong sellStrong buy
Strong sellSellNeutralBuyStrong buy
A representation of what an asset is worth today and what the market thinks it will be worth in the future.
Displays a symbol's price movements over previous years to identify recurring trends.
Frequently Asked Questions
The current price of S&P CNX NIFTY INDEX FUTURES is 26,213.00 INR — it has risen 0.03% in the past 24 hours. Watch S&P CNX NIFTY INDEX FUTURES price in more detail on the chart.
The volume of S&P CNX NIFTY INDEX FUTURES is 2.16 M. Track more important stats on the S&P CNX NIFTY INDEX FUTURES chart.
Open interest is the number of contracts held by traders in active positions — they're not closed or expired. For S&P CNX NIFTY INDEX FUTURES this number is 15.12 M. You can use it to track a prevailing market trend and adjust your own strategy: declining open interest for S&P CNX NIFTY INDEX FUTURES shows that traders are closing their positions, which means a weakening trend.
Buying or selling futures contracts depends on many factors: season, underlying commodity, your own trading strategy. So mostly it's up to you, but if you look for some certain calculations to take into account, you can study technical analysis for S&P CNX NIFTY INDEX FUTURES. Today its technical rating is strong buy, but remember that market conditions change all the time, so it's always crucial to do your own research. See more of S&P CNX NIFTY INDEX FUTURES technicals for a more comprehensive analysis.