Nifty Intraday Levels | 6-DEC-2024Nifty Options Scalping
1️⃣ Zones to Watch:
👉Green Zone: Institutional support
👉Red Zone: Institutional resistance
👉Gap: 100-200 points between zones
👉Zone Creation: Based on pivot points and Fibonacci
👉Chart: Use Nifty futures chart for reference
2️⃣ Trade Execution:
👉Order Flow: Triggers trades
👉Timeframes: 1-min & 5-min for scalping
👉Risk-Reward: 1:2 (Risk 1 to gain 2)
👉Strike Price: ATM or slightly ITM options
👉Position Sizing: Adjust to risk tolerance
3️⃣ Rules:
👉9:15 AM Sharp: Ready for market open
👉Risk Management: Top priority
👉Quick Trades: "Morning breakfast" scalps
👉Stop-Loss: 10 points
#ThankU For Checking Out Our IDEA , We Hope U Liked IT 📌
🙏 FOLLOW for more content!
👍 LIKE if you found it useful!
✍️ COMMENT below with your thoughts and feedback
NIFTYG2022 trade ideas

Nifty Intraday Levels | 9-DEC-2024Nifty Options Scalping
1️⃣ Zones to Watch:
👉Green Zone: Institutional support
👉Red Zone: Institutional resistance
👉Gap: 100-200 points between zones
👉Zone Creation: Based on pivot points and Fibonacci
👉Chart: Use Nifty futures chart for reference
2️⃣ Trade Execution:
👉Order Flow: Triggers trades
👉Timeframes: 1-min & 5-min for scalping
👉Risk-Reward: 1:2 (Risk 1 to gain 2)
👉Strike Price: ATM or slightly ITM options
👉Position Sizing: Adjust to risk tolerance
3️⃣ Rules:
👉9:15 AM Sharp: Ready for market open
👉Risk Management: Top priority
👉Quick Trades: "Morning breakfast" scalps
👉Stop-Loss: 10 points
#ThankU For Checking Out Our IDEA , We Hope U Liked IT 📌
🙏 FOLLOW for more content!
👍 LIKE if you found it useful!
✍️ COMMENT below with your thoughts and feedback

View on NiftyNifty50 is forming CPI(Change in Polarity) chart Pattern. Which Indicated a long view in nifty. Buy position can be formed with proper risk management with swing low as stoploss.

Nifty Long Trade Buy@24500 Exit @23790At current level log trade can be initiated. Nifty has formed a higher bottom structure. Swing low can be stoploss for the long possition.

nifty price has reached the demand zone. Nifty price has reached the demand done. facing rejection on smaller time frame. if sustains we can see an up move . if break down we will take a sell side trade next zone as target .

again buy side target doneBuy side trade was taken when price took rejection from demand zone, with small sl trade was taken target was supply zone .. perfectly executed and target achieved

Nifty Intraday Levels | 29-NOV-2024Nifty Options Scalping
1️⃣ Zones to Watch:
👉Green Zone: Institutional support
👉Red Zone: Institutional resistance
👉Gap: 100-200 points between zones
👉Zone Creation: Based on pivot points and Fibonacci
👉Chart: Use Nifty futures chart for reference
2️⃣ Trade Execution:
👉Order Flow: Triggers trades
👉Timeframes: 1-min & 5-min for scalping
👉Risk-Reward: 1:2 (Risk 1 to gain 2)
👉Strike Price: ATM or slightly ITM options
👉Position Sizing: Adjust to risk tolerance
3️⃣ Rules:
👉9:15 AM Sharp: Ready for market open
👉Risk Management: Top priority
👉Quick Trades: "Morning breakfast" scalps
👉Stop-Loss: 10 points
#ThankU For Checking Out Our IDEA , We Hope U Liked IT 📌
🙏 FOLLOW for more content!
👍 LIKE if you found it useful!
✍️ COMMENT below with your thoughts and feedback

Nifty Intraday Levels | 3-DEC-2024Nifty Options Scalping
1️⃣ Zones to Watch:
👉Green Zone: Institutional support
👉Red Zone: Institutional resistance
👉Gap: 100-200 points between zones
👉Zone Creation: Based on pivot points and Fibonacci
👉Chart: Use Nifty futures chart for reference
2️⃣ Trade Execution:
👉Order Flow: Triggers trades
👉Timeframes: 1-min & 5-min for scalping
👉Risk-Reward: 1:2 (Risk 1 to gain 2)
👉Strike Price: ATM or slightly ITM options
👉Position Sizing: Adjust to risk tolerance
3️⃣ Rules:
👉9:15 AM Sharp: Ready for market open
👉Risk Management: Top priority
👉Quick Trades: "Morning breakfast" scalps
👉Stop-Loss: 10 points
#ThankU For Checking Out Our IDEA , We Hope U Liked IT 📌
🙏 FOLLOW for more content!
👍 LIKE if you found it useful!
✍️ COMMENT below with your thoughts and feedback

Nifty Intraday Levels | 02-DEC-2024Nifty Options Scalping
1️⃣ Zones to Watch:
👉Green Zone: Institutional support
👉Red Zone: Institutional resistance
👉Gap: 100-200 points between zones
👉Zone Creation: Based on pivot points and Fibonacci
👉Chart: Use Nifty futures chart for reference
2️⃣ Trade Execution:
👉Order Flow: Triggers trades
👉Timeframes: 1-min & 5-min for scalping
👉Risk-Reward: 1:2 (Risk 1 to gain 2)
👉Strike Price: ATM or slightly ITM options
👉Position Sizing: Adjust to risk tolerance
3️⃣ Rules:
👉9:15 AM Sharp: Ready for market open
👉Risk Management: Top priority
👉Quick Trades: "Morning breakfast" scalps
👉Stop-Loss: 10 points
#ThankU For Checking Out Our IDEA , We Hope U Liked IT 📌
🙏 FOLLOW for more content!
👍 LIKE if you found it useful!
✍️ COMMENT below with your thoughts and feedback

Perfect example of SL hunt and trapToday's price action is a textbook example of how the big players hunt and trap the retailers. Price goes below previous supports with big bearish candles and reverses sharply to go higher.
I forgot the name, a very famous trader once told that one of the secrets behind trading success is to put your buy order where most people put their stops!

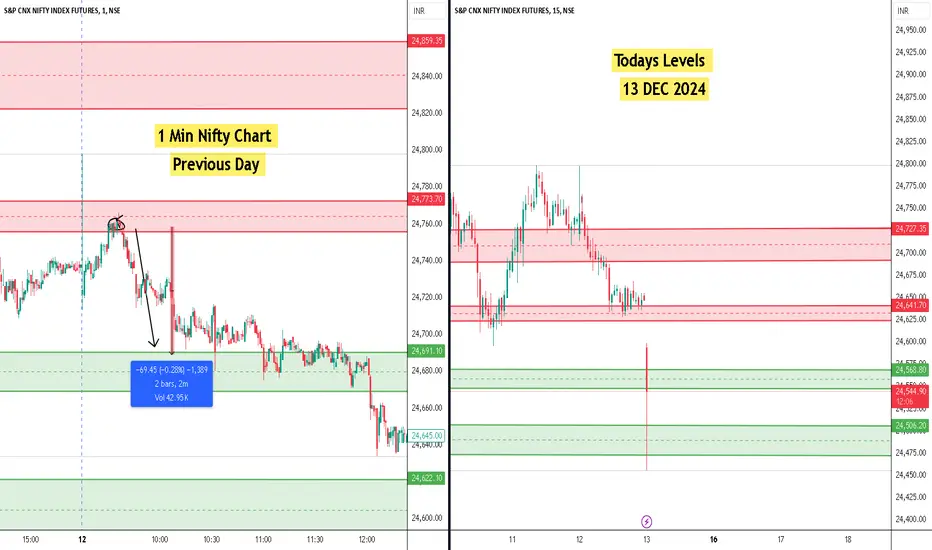
Nifty Intraday Levels | 13-DEC-2024Nifty Options Scalping
1️⃣ Zones to Watch:
👉Green Zone: Institutional support
👉Red Zone: Institutional resistance
👉Gap: 100-200 points between zones
👉Zone Creation: Based on pivot points and Fibonacci
👉Chart: Use Nifty futures chart for reference
2️⃣ Trade Execution:
👉Order Flow: Triggers trades
👉Timeframes: 1-min & 5-min for scalping
👉Risk-Reward: 1:2 (Risk 1 to gain 2)
👉Strike Price: ATM or slightly ITM options
👉Position Sizing: Adjust to risk tolerance
3️⃣ Rules:
👉9:15 AM Sharp: Ready for market open
👉Risk Management: Top priority
👉Quick Trades: "Morning breakfast" scalps
👉Stop-Loss: 10 points
#ThankU For Checking Out Our IDEA , We Hope U Liked IT 📌
🙏 FOLLOW for more content!
👍 LIKE if you found it useful!
✍️ COMMENT below with your thoughts and feedback
nifty at demand zone.nifty at demand zone , if faces rejection and sustains we can see an upmove till supply zone .
wait for proper rejection and candle closing. sl below the demand zone .
Zone to Zone trading .

waiting for a break outnifty is in a tight range with less demand , news based writing and rotation happening. a quick up move upto 25200 expected in the coming days

reversal trade when nifty reaches demand zonewhen nifty reaches demand zone . and faces rejection we will take an buy side entry targetting Supply zone with an sl below the zone .

Nifty Intraday Levels | 12-DEC-2024Nifty Options Scalping
1️⃣ Zones to Watch:
👉Green Zone: Institutional support
👉Red Zone: Institutional resistance
👉Gap: 100-200 points between zones
👉Zone Creation: Based on pivot points and Fibonacci
👉Chart: Use Nifty futures chart for reference
2️⃣ Trade Execution:
👉Order Flow: Triggers trades
👉Timeframes: 1-min & 5-min for scalping
👉Risk-Reward: 1:2 (Risk 1 to gain 2)
👉Strike Price: ATM or slightly ITM options
👉Position Sizing: Adjust to risk tolerance
3️⃣ Rules:
👉9:15 AM Sharp: Ready for market open
👉Risk Management: Top priority
👉Quick Trades: "Morning breakfast" scalps
👉Stop-Loss: 10 points
#ThankU For Checking Out Our IDEA , We Hope U Liked IT 📌
🙏 FOLLOW for more content!
👍 LIKE if you found it useful!
✍️ COMMENT below with your thoughts and feedback

Nifty Intraday Levels | 11-DEC-2024Nifty Options Scalping
1️⃣ Zones to Watch:
👉Green Zone: Institutional support
👉Red Zone: Institutional resistance
👉Gap: 100-200 points between zones
👉Zone Creation: Based on pivot points and Fibonacci
👉Chart: Use Nifty futures chart for reference
2️⃣ Trade Execution:
👉Order Flow: Triggers trades
👉Timeframes: 1-min & 5-min for scalping
👉Risk-Reward: 1:2 (Risk 1 to gain 2)
👉Strike Price: ATM or slightly ITM options
👉Position Sizing: Adjust to risk tolerance
3️⃣ Rules:
👉9:15 AM Sharp: Ready for market open
👉Risk Management: Top priority
👉Quick Trades: "Morning breakfast" scalps
👉Stop-Loss: 10 points
#ThankU For Checking Out Our IDEA , We Hope U Liked IT 📌
🙏 FOLLOW for more content!
👍 LIKE if you found it useful!
✍️ COMMENT below with your thoughts and feedback

Todays Trade Plan Today we will take sell side entry when price reaches supply zone n faces rejection. Or if it reaches demand zone n face rejection we will take buy side entry

Nifty Intraday Levels | 10-DEC-2024Nifty Options Scalping
1️⃣ Zones to Watch:
👉Green Zone: Institutional support
👉Red Zone: Institutional resistance
👉Gap: 100-200 points between zones
👉Zone Creation: Based on pivot points and Fibonacci
👉Chart: Use Nifty futures chart for reference
2️⃣ Trade Execution:
👉Order Flow: Triggers trades
👉Timeframes: 1-min & 5-min for scalping
👉Risk-Reward: 1:2 (Risk 1 to gain 2)
👉Strike Price: ATM or slightly ITM options
👉Position Sizing: Adjust to risk tolerance
3️⃣ Rules:
👉9:15 AM Sharp: Ready for market open
👉Risk Management: Top priority
👉Quick Trades: "Morning breakfast" scalps
👉Stop-Loss: 10 points
#ThankU For Checking Out Our IDEA , We Hope U Liked IT 📌
🙏 FOLLOW for more content!
👍 LIKE if you found it useful!
✍️ COMMENT below with your thoughts and feedback

Trade - 2 ActiveFind only short setup. Longs will be trapped. Trade active minimum hold 150 points in nifty.
Challenge Day - 2
#niftydecoding


Todays trade setupWe will buy when price reaches demand zone and sell when price reaches supply zone. No random trades in between the zone.

Nifty Intraday Levels | 5-DEC-2024Nifty Options Scalping
1️⃣ Zones to Watch:
👉Green Zone: Institutional support
👉Red Zone: Institutional resistance
👉Gap: 100-200 points between zones
👉Zone Creation: Based on pivot points and Fibonacci
👉Chart: Use Nifty futures chart for reference
2️⃣ Trade Execution:
👉Order Flow: Triggers trades
👉Timeframes: 1-min & 5-min for scalping
👉Risk-Reward: 1:2 (Risk 1 to gain 2)
👉Strike Price: ATM or slightly ITM options
👉Position Sizing: Adjust to risk tolerance
3️⃣ Rules:
👉9:15 AM Sharp: Ready for market open
👉Risk Management: Top priority
👉Quick Trades: "Morning breakfast" scalps
👉Stop-Loss: 10 points
#ThankU For Checking Out Our IDEA , We Hope U Liked IT 📌
🙏 FOLLOW for more content!
👍 LIKE if you found it useful!
✍️ COMMENT below with your thoughts and feedback

Taken sell side tradeobserved the price rejection at supply zone on smaller time frame. took sell side entry keeping sl above the zone and target as Demand Zone . I dont take random trades. I trade only when price reaches a key zone .
