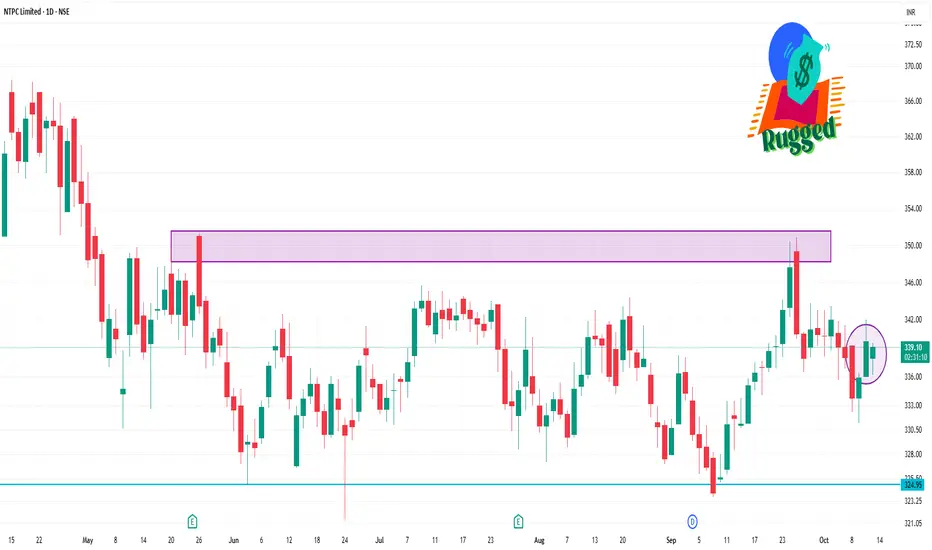
NTPC - Consolidation or SidewaysConsolidating between 320 to 350 since last 6 months.
BUY at support range 320 - 325 and SELL at resistance range 345 - 350.
SL below 320 (DAILY CLOSE)
Next report date
—
Report period
—
EPS estimate
—
Revenue estimate
—
24.50 INR
234.22 B INR
1.85 T INR
4.74 B
About NTPC Limited
Sector
Industry
CEO
Gurdeep Singh
Website
Headquarters
New Delhi
Founded
1975
ISIN
INE733E01010
FIGI
BBG000BMWLG9
IPO date
Oct 7, 2004
IPO offer price
1.35 USD
NTPC Ltd. engages in the generation of electric power in coal based thermal power plant. It operates through the Generation of Energy and Others segments. The Generation of Energy segment involves the generation and sale of bulk power to State Power utilities. The Others segment includes provision of consultancy, project management and supervision, energy trading, oil and gas exploration, and coal mining. The company was founded on November 7, 1975 and is headquartered in New Delhi, India.
Related stocks

NTPC 4hrs T.F & Weekly T.F Chart analysis.*4hrs T.F - Making bullish candles in 4hrs time frame.
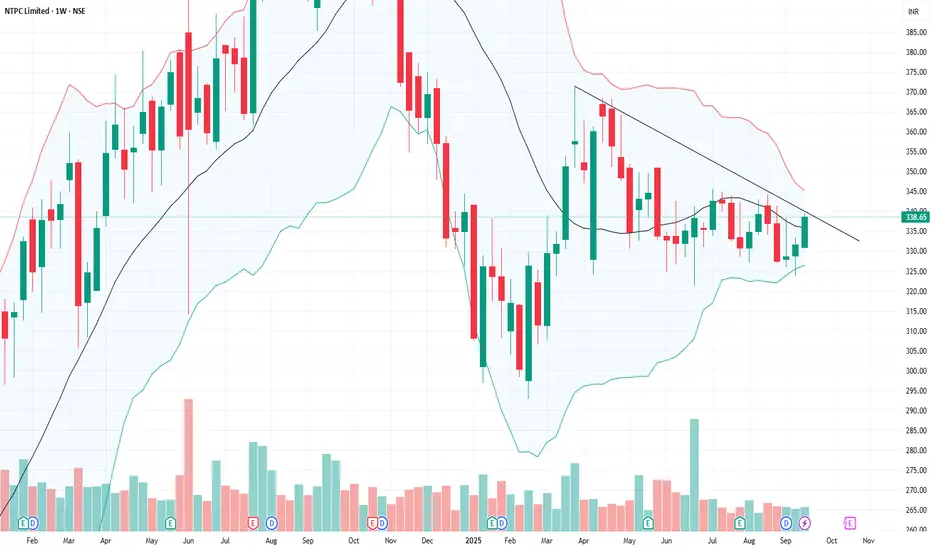
*W T.F - Making Darvas box pattern in weekly time frame.
NTPC long trades in cash market & NTPC NOV 350 CE in index option trades.

NTPC 1 Day Time Frame📈 Intraday Support & Resistance Levels
Immediate Support: ₹337.29
Immediate Resistance: ₹340.85
Key Pivot Point: ₹339.20
These levels are derived from standard pivot point calculations and are commonly used by traders for short-term strategies.
🔍 Technical Indicators
Relative Strength Index (
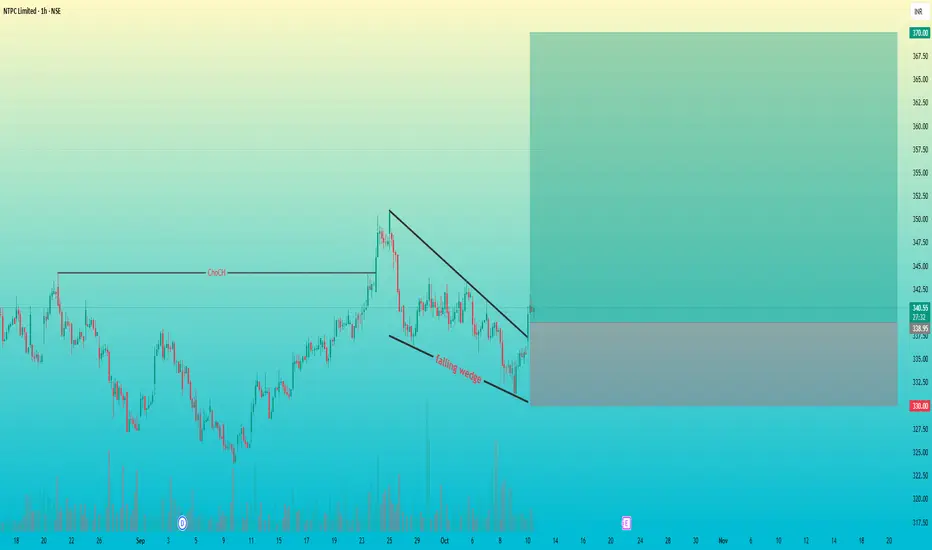
NTPC Breakout Alert| Falling Wedge+ChoCH = Bullish Continuation⚡ NTPC Limited (NSE: NTPC) – 1H Chart Analysis
🧠 Market Structure
After a strong impulsive move up, the price created a Change of Character (ChoCH) — signaling a shift from bearish to bullish market structure.
Post-ChoCH, price entered a falling wedge corrective pattern — a typical bullish continu
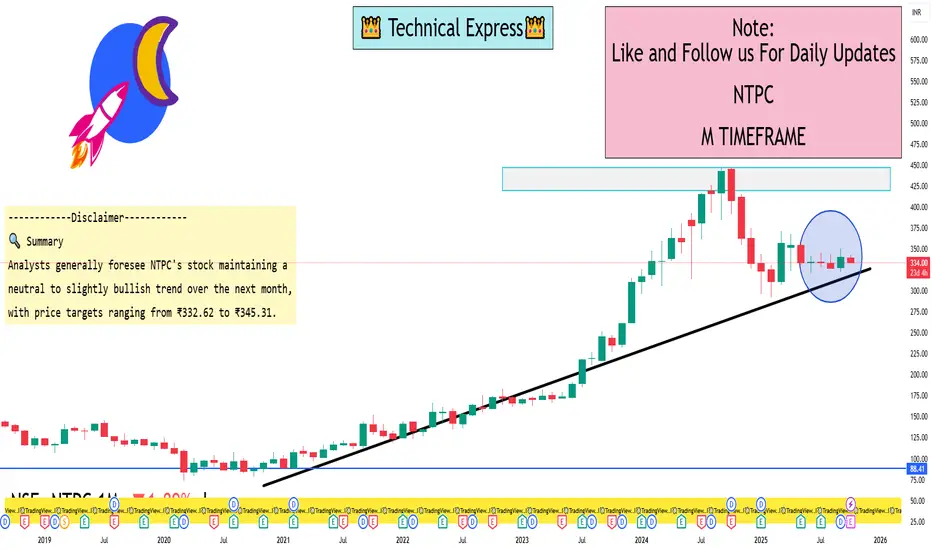
NTPC 1 Month View📊 1-Month Price Targets & Forecasts
WalletInvestor: Projects a price range of ₹332.62 to ₹345.31 within the next 14 days, with a potential upside to ₹416.02 over the next year.
MunafaSutra: Identifies immediate support at ₹326.63 and resistance at ₹338.93, suggesting a sideways trading range.
St
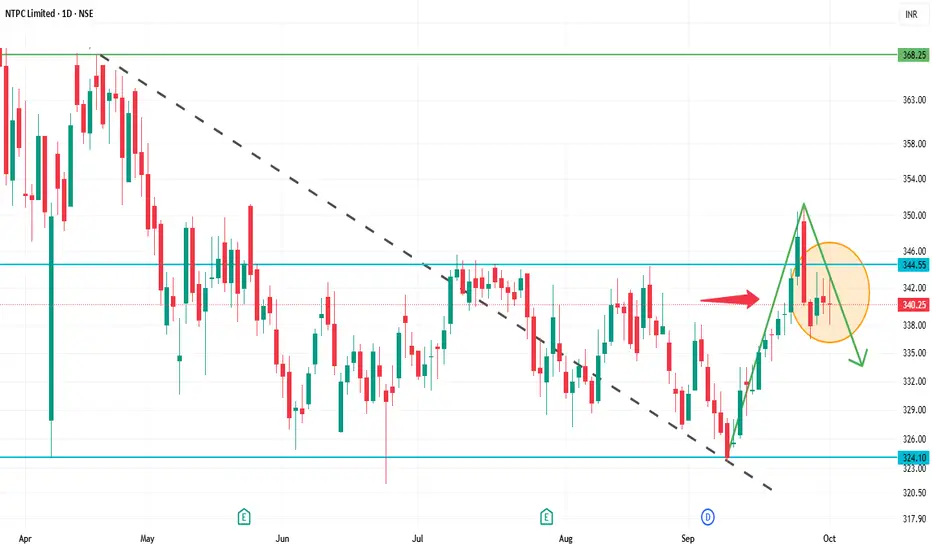
NTPC 1D Time frameCurrent Snapshot
Current Price: ₹340.25
52-Week High: ₹447.75
52-Week Low: ₹292.80
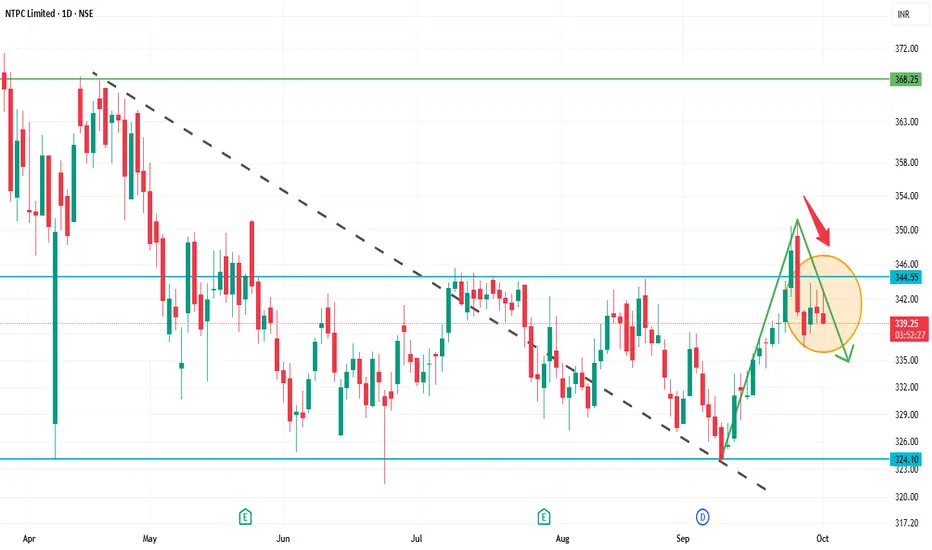
Strategy & Outlook
Bearish Bias: The stock is in a short-term downtrend with negative momentum indicators.
Selling Opportunity: Consider selling near resistance zones (₹343–₹345) with a target towards ₹335–₹340.
NTPC 1D Time frameOpening Price: ₹340.30
Closing Price: ₹340.25
Day Range: ₹339.45 – ₹343.05
📉 Trend Analysis
Short-Term Trend: Bearish — The stock is trading below key moving averages, confirming the bearish trend.
Medium-Term Trend: Neutral — The stock is in a consolidation phase, characterized by lower highs
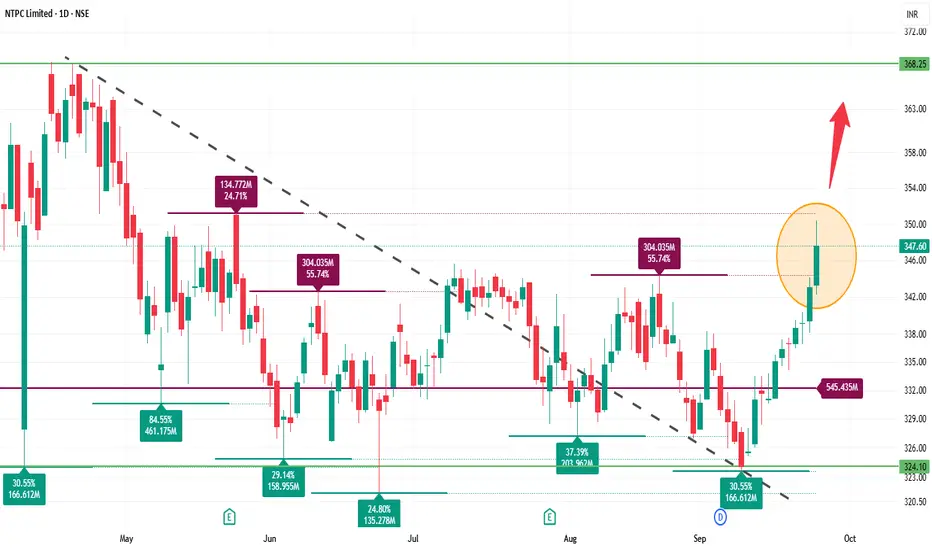
NTPC 1D Time frame📊 Today's Performance
Closing Price: ₹347.55
Day’s Range: ₹342.25 – ₹350.40
Previous Close: ₹343.00
Change: Up +1.33%
52‑Week Range: ₹292.80 – ₹448.45
Market Cap: ₹3.37 lakh crore
P/E Ratio: 14.07
Dividend Yield: 2.40%
EPS (TTM): ₹24.71
Beta: 1.06 (moderate volatility)
🔑 Key Technical Lev
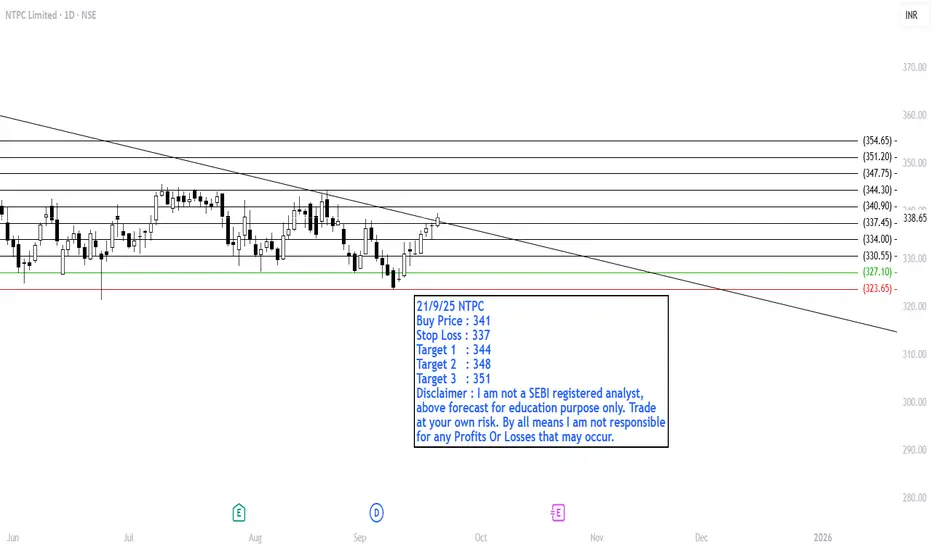
BUY NTPC21/9/25 NTPC
Buy Price : 341
Stop Loss : 337
Target 1 : 344
Target 2 : 348
Target 3 : 351
Disclaimer : I am not a SEBI registered analyst,
above forecast for education purpose only. Trade
at your own risk. By all means I am not responsible
for any Profits Or Losses that may occur.
NTPC BULLISH VIEWNTPC after 17 week of consolidation ultimately stock gave weekly positive closing above 20 SMA , now upward journey will start , short term target 345, above tradeline closed bigeer target will b open up ..370..sl wil b 323
See all ideas
Summarizing what the indicators are suggesting.
Neutral
SellBuy
Strong sellStrong buy
Strong sellSellNeutralBuyStrong buy
Neutral
SellBuy
Strong sellStrong buy
Strong sellSellNeutralBuyStrong buy
Neutral
SellBuy
Strong sellStrong buy
Strong sellSellNeutralBuyStrong buy
An aggregate view of professional's ratings.
Neutral
SellBuy
Strong sellStrong buy
Strong sellSellNeutralBuyStrong buy
Neutral
SellBuy
Strong sellStrong buy
Strong sellSellNeutralBuyStrong buy
Neutral
SellBuy
Strong sellStrong buy
Strong sellSellNeutralBuyStrong buy
Displays a symbol's price movements over previous years to identify recurring trends.
Frequently Asked Questions
The current price of NTPC is 322.95 INR — it has increased by 0.05% in the past 24 hours. Watch NTPC Limited stock price performance more closely on the chart.
Depending on the exchange, the stock ticker may vary. For instance, on NSE exchange NTPC Limited stocks are traded under the ticker NTPC.
NTPC stock has fallen by −1.24% compared to the previous week, the month change is a −3.67% fall, over the last year NTPC Limited has showed a −12.47% decrease.
We've gathered analysts' opinions on NTPC Limited future price: according to them, NTPC price has a max estimate of 490.00 INR and a min estimate of 325.00 INR. Watch NTPC chart and read a more detailed NTPC Limited stock forecast: see what analysts think of NTPC Limited and suggest that you do with its stocks.
NTPC reached its all-time high on Sep 30, 2024 with the price of 448.45 INR, and its all-time low was 58.35 INR and was reached on Nov 5, 2004. View more price dynamics on NTPC chart.
See other stocks reaching their highest and lowest prices.
See other stocks reaching their highest and lowest prices.
NTPC stock is 1.00% volatile and has beta coefficient of 0.88. Track NTPC Limited stock price on the chart and check out the list of the most volatile stocks — is NTPC Limited there?
Today NTPC Limited has the market capitalization of 3.13 T, it has increased by 0.88% over the last week.
Yes, you can track NTPC Limited financials in yearly and quarterly reports right on TradingView.
NTPC Limited is going to release the next earnings report on Jan 26, 2026. Keep track of upcoming events with our Earnings Calendar.
NTPC earnings for the last quarter are 5.20 INR per share, whereas the estimation was 5.30 INR resulting in a −1.89% surprise. The estimated earnings for the next quarter are 5.37 INR per share. See more details about NTPC Limited earnings.
NTPC Limited revenue for the last quarter amounts to 447.86 B INR, despite the estimated figure of 433.19 B INR. In the next quarter, revenue is expected to reach 473.19 B INR.
NTPC net income for the last quarter is 50.67 B INR, while the quarter before that showed 60.11 B INR of net income which accounts for −15.70% change. Track more NTPC Limited financial stats to get the full picture.
NTPC Limited dividend yield was 2.33% in 2024, and payout ratio reached 34.57%. The year before the numbers were 2.31% and 36.11% correspondingly. See high-dividend stocks and find more opportunities for your portfolio.
As of Dec 5, 2025, the company has 142.92 K employees. See our rating of the largest employees — is NTPC Limited on this list?
EBITDA measures a company's operating performance, its growth signifies an improvement in the efficiency of a company. NTPC Limited EBITDA is 538.17 B INR, and current EBITDA margin is 29.35%. See more stats in NTPC Limited financial statements.
Like other stocks, NTPC shares are traded on stock exchanges, e.g. Nasdaq, Nyse, Euronext, and the easiest way to buy them is through an online stock broker. To do this, you need to open an account and follow a broker's procedures, then start trading. You can trade NTPC Limited stock right from TradingView charts — choose your broker and connect to your account.
Investing in stocks requires a comprehensive research: you should carefully study all the available data, e.g. company's financials, related news, and its technical analysis. So NTPC Limited technincal analysis shows the sell today, and its 1 week rating is sell. Since market conditions are prone to changes, it's worth looking a bit further into the future — according to the 1 month rating NTPC Limited stock shows the neutral signal. See more of NTPC Limited technicals for a more comprehensive analysis.
If you're still not sure, try looking for inspiration in our curated watchlists.
If you're still not sure, try looking for inspiration in our curated watchlists.