patanjai foods as you see its revers head and solder pattern on chart . its sems to be its upside from here . its is not any buy sell call .
PATANJALI trade ideas

CUP AND HANDEL IN PATANJALI FOODSmay possible breakout in patanjali foods,
breakout after weeks long resistance.
greater chance of brekout , unless any bad news in market.

Adx Squeeze & Near Supportit is in Support Zone Seen Buying, if Buying Continue it will Surely Break the Trendline and Certainly Achieving Higher Target...

Patanjali foodsWe have seen a pole and flag pattern on the stock. Also, the stock is in bullish mode. Long above 1212. All important levels are marked on the charts. RSI levels above 60 are a sign of strength.
This is for your educational purpose only.

PATANJALI FOODS IS READY?DISCLAIMER
Our video is intended only to provide general and preliminary information to traders/investor and shall not be considered as any investment decision. Do your own analysis, This is not a buy or sell tip. This is just for educational purpose only. And I'm not responsible for your Profit or loss as I'm not a SEBI registered financial advisor.

Patanjali : Where Nature Meets Science!Technical Analysis :
Strength : Good
Chart Type: Weekly
Chart Pattern : Inverse Head and Shoulder
RSI : Above 50
Price : Above 20 MA

its good time to avoid to long position in patanjliif you look care fully its in daily time frame its going long but if you look weekly time frame so then you undertand its shows bearish singnal


BO at an Important support - Good Buildup at the resistance before BO
- BO validated with Volume
- Above Key EMAs
- Bullish RSI

PATANJALI FOODS BREAKOUT BREAKOUT in patanjali foods add some quantity at cmp , place stoploss at days low


Watchout for Resistance Breakout (cash trade - positional)The stock is testing it's resistance zone and looks good above 1055 level for positional targets of 1095 and 1125.
Buy small quantity in this counter due to less volumes.
This is purely a positional idea and should be taken on day closing basis.
Learn & Earn,
Dr. Tanya Kumar

PATANJALI - Weekly AnalysisIn the Weekly Chart of PATANJALI ,
we can see that; it has given breakout from W Pattern.
Let it retest then enter with SL.

PATANJALIIn the Weekly chart of PATANJALI ,
We can see that, it has given a breakdown.
let it give a pullback and we can see a breakdown till 700-750.
let it form a Bullish candle or pattern at 700-710 levels and then we can be see a uptrend from here.

Patanjali Foods Ltd Positional TradeChart shows support at 365 EMAs. We advice to go long at Current Market Price. Weekly chart shows uptrend in the price.

patanjali time to book profits booked profits today will accumulate again on lower levels
suddenly there are a lot of buy calls on Patanjali from various broking houses for me i like to take lonely trades never follow the crowded trade there was no coverage when the stock was at 1000 levels suddenly there are a lot of buy calls coming from many directions that is a warning signal i will add on lower levels and not comfortable with the stock gaining so much limelight
and technically also there are few early signal of a pullback on daily charts rsi is facing resistance on 60/65 levels and has completed 5 up waves and is going into a correction waves and on weekly has completed third wave on weekly i will wait for 4th downwave completion and then renter again this is just a pullback in the stock major trend is intact

high return swing tradePatanjali foods is set to breakout , it has made a formation on monthly chart for breakout and ready to blast so , be ready to see breakout in Patanjali foods

UPDATE ON PATANJALI FOODSNo real need to panic until this pattern is holding although the market overall is not looking good in the short term

PATANJALI - Ichimoku Bullish Breakout Stock Name - Patanjali Foods Ltd
Ichimoku Cloud Setup :
1). Today's close is above the Conversion Line
2). Future Kumo is Turning Bullish
3). Chikou span is slanting upwards
All these parameters are showing bullishness at Current Market Price
and more bullishness AFTER crossing 1400
#This is not Buy and Sell recommendation to any one. This is for education purpose and a helping hand to learn trading in Market.
# Cloud Trading
# Ichimoku Cloud
# Ichimoku Followers
I hope you all like my analysis.
Please do share your thoughts into comment section.
Please give a like, it motivates me to do analysis.

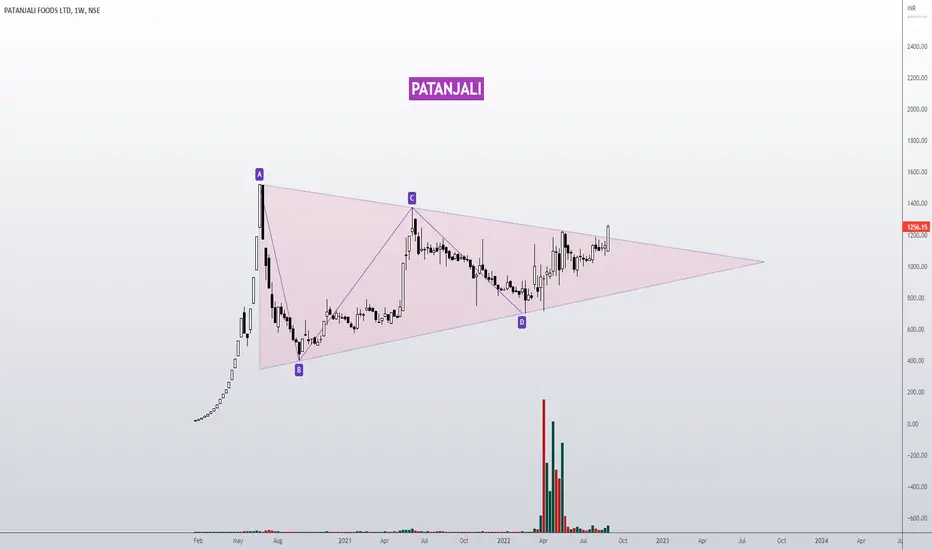
Picture-perfect symmetrical triangleChart -> Patanjali Weekly
High volatile stock, but the pattern is superior to anything!
A picture-perfect symmetrical triangle breakout in Patanjali can take it to an all-time high again.
CMP: 1256
Good to add: 1140 to 1200
Target: 1370, 1515
SL: 1100, weekly close
Disclaimer: This is for educational purposes only, not any recommendations to buy or sell. As I am not SEBI registered, please consult your financial advisor before taking any action.

PATANJALISYMMETRICAL TRIANGLE BREAKOUT
Buy @ cmp & in dips till 1160 | WCBSL 920 | Tgt 1750 / 2200 / 2700

PATANJALI symmetrical Triangle BreakoutNSE:PATANJALI BSE:PATANJALI
Time Frame – Weekly
Technical Observations –
1) Symmetrical Triangle pattern Breakout done with good volume
Resistance – 1375/1735/2220/2545
Support – 700
Chart Already shared on 16th April 2022
DISCLAIMER: NCFM Certified Technical Analyst. I am not SEBI registered analyst. All posts are for educational purpose only. I am not responsible for your any loss or profit. Consult your adviser before taking any trade. I help people to learn technical analysis & charts reading.
Bullish In Pantanjalitriangle pattern breakout with increase in volume.
Can give 75% return is 6-9months
