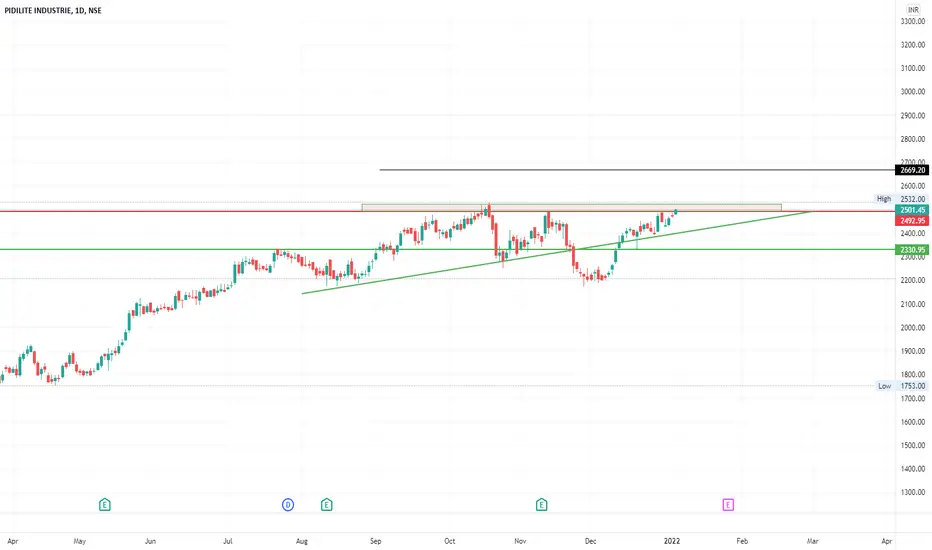
Pidilite starts upward swingPidilite supported at Fib level 61% and Trend reversal with bullish candle, Can we expect good upward Move? My target is 2700. Let see Keep calm and wait.
Trade ideas

PIDILITE Bouncing from 100 EMA
Bouncing from 100 EMA
Bouncing from 100 EMA
Bouncing from 100 EMA
Bouncing from 100 EMA


Gem PidiliteNo Matter What, Some Stocks Like Pidilite Never Disappoint Investors.
Have You Find Any Big Fall/ Crash, Not Even March 2020 Visible

Buy Call On Pidilit IndustriesBuy at the mentioned levels that stock is now in short term uptrend movement.


Buy above CMP SL 2686 TGT 2740 2753, (2817 short term)Suggestions are based on my analysis only. Please do your analysis before taking any trade.

Go LongGo Long in Pidilite, nice breakout with good momentum is observed.
R:R 1:2 ATR, managing risk is more important than strategy.

Looking good for higher targets!Broke out of C&H Pattern. Looking good for 2530+. Above 2532, it's virgin territory.

Pidilite Cmp 2599 dated 4.1.2022 RALLY TO CONTINUEPidilite Cmp 2599 dated 4.1.2022
1. REctangle BO @ 2530
2. Triangle BO @ 25
Buy @ Cmp for a tgt of 2750-2900 SL 2525
It is just a view, pls trade at your own risk.


Breakout and Retest in PIDILITEPidilite Industries showing a retest after nreakout. Possibility of a good move from here.
Note: I am not SEBI registered. All ideas are only for educational purpose only.

Breakout in Pidilite Industries...Chart is self explanatory. Entry, Targets and Stop Loss are mentioned on the chart.
Disclaimer: This is for demonstration and educational purpose only. This is not buying or selling recommendations. I am not SEBI registered. Please consult your financial advisor before taking any trade.

Target 1 (26%) achieved in Pidilite Industries. Target 2 is ON..This is follow-up on Pidilite Industries. Can check link to related ideas.
Target 1 achieved. More than 26%. Target 2 is ON.
Chart is self explanatory. Entry, Targets and Trailing Stop Loss are mentioned on the chart.
Disclaimer: This is for demonstration and educational purpose only. This is not buying or selling recommendations. I am not SEBI registered. Please consult your financial advisor before taking any trade.

PIDILITIND LOOKS GOOD BUY 2490-2503 T1 2550 T2 2580 T3 2640 SL 2477-DKM SIR
I can see the upmove
buy as per your risk

PIDILITE PIDILITE
ABOVE 2470
TARGET 2530,2600(INTER DAY target 2530) and more upside comming days
Stop loss 2450

It form cup with handle pattern in 1 day chartif it breaks neckline, we can expect a big move in short term
Concentrate if it break and sustain above 2482

#Pidiliteind cash : Looks good above 2455#Pidilite ind cash -Posiitonal call
22.Dec 2021
Looks good above 2455 Stoploss 2420
Target 2495-2500/2540
cmp 2432

Buy at 2370 SL 2350 TGT 2380, 2390 and 2407Suggestions are based on my analysis only. Please do your analysis before taking any trade.

PIDILITIND DO YOUR OWN RESEARCH
Good bullish move right now(Wicks are a big concern though), but should wait for the resistance breakout, if it breaks out you can expect a good move

[POSITIONAL] PIDILITIND LONG BET risk: Reward ratio is 1: 2
Rest as per Charts
********
Note -
One of the best forms of Price Action is to not try to predict at all. Instead of that, ACT on the price. So, this chart tells “where” to act in “what direction. Unless it triggers, like, let’s say the candle doesn’t break the level which says “Buy/Sell if it breaks”, You should not buy/sell at all.
=======
I use shorthands for my trades.
“Positional” - means You can carry these positions and I do not see sharp volatility ahead.
“Intraday” -means You must close this position at any cost by the end of the day.
=======
Always follow a stop loss.
In the case of Intraday trades, it is mostly the “Low/High of the Candle”.
In the case of Positional trades, it is mostly the previous swings
********

PIDILITIND bouncing back from it's support zone PIDILITIND is at buy level and target could be a new life-time high
