PIDILITE Weekly breakout with huge volumePIDILITE has confirmed weekly Breakout with huge volume. Expect 20-30% ROI in stock in coming few weeks till Diwali.
Happy Investment.
PIDILITIND trade ideas

PIDILITIND | Flag breakout in 2H time framePIDILITIND | Flag breakout in 2H time frame - Anyone seeing cobra structure :D

PIDILITEPidilite has given a good closing above falling trendline.
Can be considered a good Buy.
Disc-Not Investment Advice
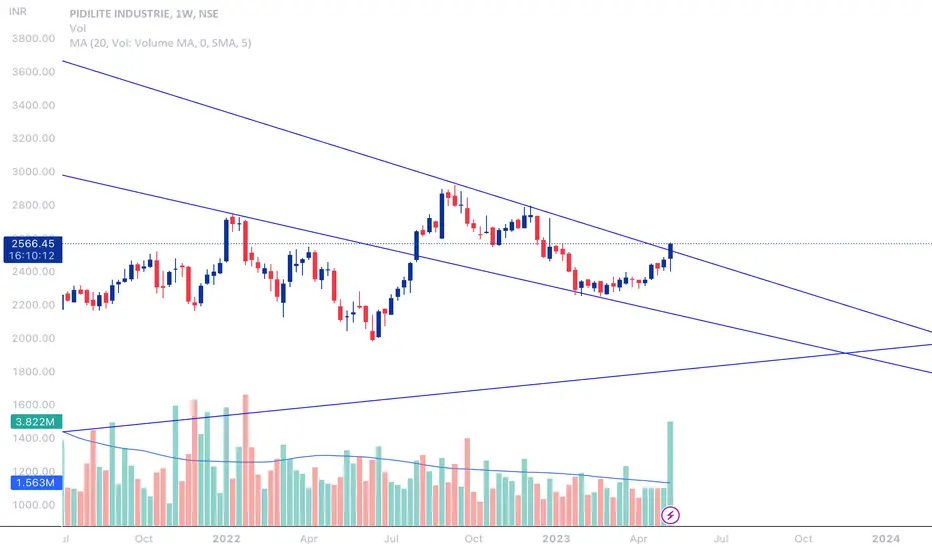

PIDILITE Weekly chart suggest Buy with limited downside riskPIDILITE Weekly Chart suggest Buy for 20-30 % Returns in next 6 Months.

Swing tradePidilite looking good for swing trade in the upcoming week, with good risk reward, and the market as a whole looking very bullish.

PIDILITE INDPrice has an established long term up-trend.
As per its pattern in the entire up-move, prices have taken support at the 23.6% FR Level.
The Monthly RSI has also bounced from its Oversold zone.
On the Daily Chart, price has broken out of a consolidation, which suggests resumption of longer term up-move.
We cannot define a proper target, but for a start, we can expect a new all time high at the least.

Weakest Stock : Pidilite IndustriesWeakest Stock : Pidilite Ind
Sell At Cmp - 2308.55 Or On Any Rise
SL - 2428 ( Weekly Closing Basis )
Target - 2000/1870

PIDILITEINDPIDILITE made butterfly pattern on hourly charts with good volumes & trading comfortably above breakout point.
Could be bought with mentioned stoploss & target.

PIDILITE is buy on Daily ChartsPIDILITE after Correction is forming Rounding Base on Daily Charts -- Can touch 2600-2800 in may Series.

PidilitePidilite
Good breakout from wedge
Keep an eye
CMP 2433
Any dips to 2400 can be bought
SL 2340
If works out may move towards 2600/2780

Rising wedge pattern reversal in Pidilite Industries Pidilite Industries
Key highlights: 💡
✅On 1 week Time Frame Stock Showing Reversal of Rising wedge Pattern .
✅It can give movement upto the Reversal target of above 3000+(Up to resistance level).
✅Can Go Long in this stock by placing a stop loss below 2298-.

PIDILITIND AnalysisQuater results - 2023-05-08
Everything is clearly mentioned in the chart.
16 April 23
For Learning Purpose.

STOCKS TO KEEP ON RADAR FOR UPCOMING SESSIONSNSE:PIDILITIND
Stocks to keep on the radar for upcoming sessions.
1. Pidilite
2. Axis Bank
3. OFSS
4. PEL
5. MFSL
All stocks have a bearish bias and the analysis is explained in the video
This is only for educational purposes only.
Always trade with stop-loss.
I hope you found this idea helpful.
Please like and comment.
Share with Your Friends.
Keep Learning,
Happy Trading!

6th April, 2023 - PIDILITIND (Intraday Trade) #stocksAnalysis Criteria Used:
1. Please find the Chart Analysis done for the 6th April, 2023
2. The analysis for the Intraday Trade ideas, has been done based on Trend analysis and Chart Patterns with Volume Buildups
Focus On:
1. Always keeping your Risk Management in play
2. Using a Stop Loss; because it is your Best Friend
3. Always Plan your Trade and stick to your Plan
4. Dont overthink or overanalyse
5. Treat this as your Business and get serious about it
#sharemarket #stockmarket #nifty #sensex #investing #trading #nse #bse #stockmarketindia #stocks #indianstockmarket #investment #stockmarketnews #banknifty #finance #money #intraday #intradaytrading #investor #niftyfifty #dalalstreet #sharemarketindia #sharemarketnews #stockmarketinvesting #business #sharemarkettips #stock #india #indiansharemarket #rakeshjhunjhunwala #bhfyp #mumbai #share #wealth #investment #market #invest #trading #investing #finance #FinancialFreedom #investor #trader #stocks #profit #investors #economy #equity #shares #nifty #stockexchange
DISCLAIMER:
.
* Please do your own research and/or contact your financial advisor before taking any trading opportunities
** We will not be responsible for your profit or loss
*** We are NOT SEBI REGISTERED
______________________
best stocks to buy today
best stocks to buy now
best stocks to buy
best stocks for Intraday tomorrow
best stocks for long term investment
best stocks to buy today india
best stocks for swing trading
swing trading strategies
swing trading beginners
what is swing trading
swing trading stocks
swing trading stock selection
swing trading kya hai
nifty analysis
nifty view
bank nifty analysis
top stocks to buy now
strong stocks
nifty view
nifty prediction
stock market view tomorrow
bank nifty Levels
bank nifty prediction
share news
stock market news
best stocks to buy now
profit booking stocks
multibagger stocks in discount
breakout stocks
best short term stocks
best short term shares
next multibagger stocks

LONG CALL ON Pidilite LtdBreakout on the stock
Above 23 Jan highs
Target 2425/2460
Stop loss 2370
I am just representing my views
For educational purpose only.

PIDILITE INDUSTRIES - DESPERATE TIMES !As you can see, PIDILITE INDUSTRIES is at a major support level .
Will it maintain support?
.
Case - 1: If the price breaks above R1 - Rs. 2370, then we will see an upside in the stock.
.
Case - 2: If the price breaks above S1 - Rs. 2260, then there will be further downside will be expected.
In such a scenario, the price will fall to S2 - Rs. 2175, as denoted by the Harmonic Pattern.
.
.
.
Follow me for more!

Pidilite is in Buy listBuy pidilite above 2360 on daily closing basis for target of 2550+
Range break out after consolidation.

Ready to shoot up in PidilitindPure Astro analysis entry @2180 for 1-3 month target date is 7june,13july,19august

Pidilite Cmp 2351 dated 6-3-2023 Rectangle BOPidilite Cmp 2351 dated 6-3-2023
1. Rectangle Consolidation
2. BO above 2355
Buy above 2355 for target 2380-2425-2440-2460 SL 2300
Disclaimer :
I am not a SEBI registered Analyst so please do your own Analysis before taking any action.
The above view is shared just for educational purpose.
By no means shall be responsible for any losses amounting out of it incase if any trades on it.
It is just a view, please trade at your own risk.


Pidilite Industries - Short Candidate - Broken Imp SupportAccording to price action, NSE:PIDILITIND is showing signs of exhaustion and weakness. Reasons why I think this is a short candidate -
1) Both the Daily and Weekly candles appear to be weak.
2) Future OI has been unwinding long for the last 5 days, and there was short build up in this stock today as well.
3) DTF has formed a bearish marubozu candle.
4) For the targets shown on the chart, one can short with a stop loss of 2560. If the candle closes below 2381 on any given day, expect 2200 in the coming sessions, which would be a good base to go long in this stock.
Let's see how the story develops. Best wishes!
Disclaimer -
- The opinions expressed here are my own. This is for my own records as well as what I see on charts.
- If you are referring to this, please keep in mind that it is only for educational and research purposes.
- Past performance is no guarantee of future results.
- You must accept responsibility for any decision you make. DO NOT TAKE THIS AS AN INVESTMENT RECOMMENDATION.
- It's your hard-earned cash. Trade / Invest wisely, keeping in mind your trading style, goals and objectives, time horizon, and risk tolerance.
- Before investing, conduct your own research and consult with a financial advisor.
TIA!

PIDILITIND SERIES OF BEARISH FLAGS !!!!Chart patterns look apt for a short trade in Pidilite industries
REASONS
1. PIDILITIND from September 2022 has been in Downtrend forming lower highs and lower lows
2. Currently it is ,at its 3rd BEARISH FLAG pattern (gave breakdown with volume spike)
3. Previous 2 Bearish flags achieved their targets(as per pattern-pole length) without any sluggishness
4. There is DEMAND ZONE down near 2100 levels
5. SL as shown @ chart
6. Target - 2140, 2100(trail the SL)
7. Lower low formed on Friday(24 Feb) increases the probability of our short trade
Let's wait and watch how it moves!!!!
NOTE- Just Sharing my view...not a tip nor advice!!!
