Trade ideas

## Pidilite ##Buy pidilite within 1456 to 1465 with a stoploss of 1410 for a target of around 1500..1530..1550++


Price at Resistance in PIDILITINDPrice is currently at Resistance in PIDILITIND. Wait for reversal or breakout confirmation to take position .
If resistance break with breakout candle ( Good volume and big body candle) go long . Else if it reverses go for short but no large target as trend is up .
Disclaimer: All charts are purely for educational and information purpose only. Invest or Trade at your own risk.


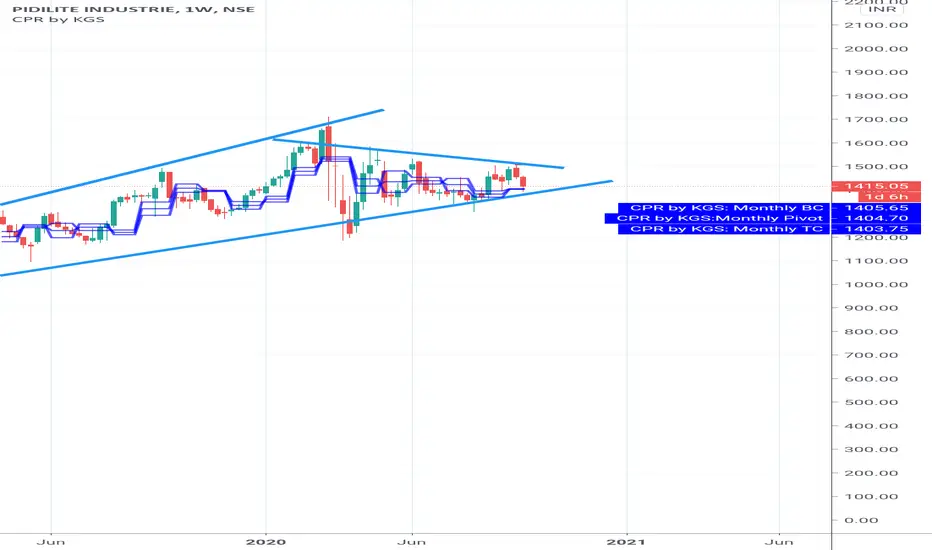
Weekly levels (28 september to 02 October 2020) - PIDILITINDweekly levels for 28 september to 02 October 2020


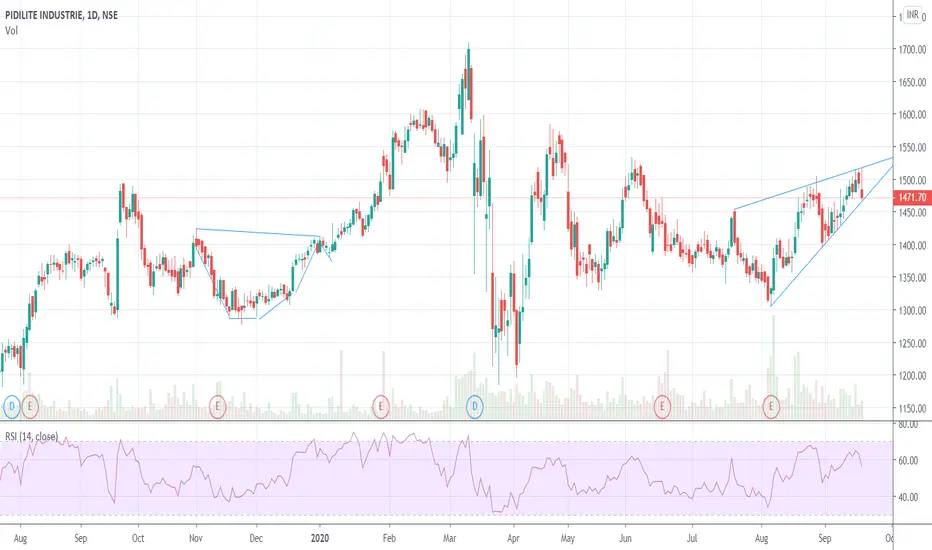
PIDILITE - RISING WEDGE PATTERN Greetings ! Price movement has gradually formed a rising wedge pattern. This is a bearish pattern on breakout.


PIDILITIND (Breakout) Continuously Consolidating in a RangePidilite Industries Limited ( NSE:PIDILITIND ) is continuously Consolidating in Range Zone (Trandline Zone). This can become a very good trade for intraday traders.
Chart Published By Ravinder Sharma


