[Turtle] Pidilite Pair TradingSelling 1400PE of Pidilite to compensate the extreme moves of Asian Paints.
Pidilite's main ingredient comes from Vinyl Acetate Monomer, a derivative of crude oil.
Asian Paint's main ingredient also comes from Crude oil.
So adding as a pair trade to this strategy -
Shorting PE means bullish view.
Trade ideas

TNM-SUPPORT RESISTANCEThis indicator is to be used for the simple support and resistance and tool for the mentioned time frame only
Kindly use the same at your own Risk and verify before using the same

Pidilite best buy 1422 to 1412 SL- 1312 TGT 1 - 1512, 1532 & 158WAIT FOR LEVELS TO COME.
* FOR EDUCATIONAL PURPOSE ONLY

Have the Big players just entered?Spinning top candle formation after many bearish candles
Bigger Green Volume Bar
MACD positive


Pidilite The stock is taking support at EMA 21 levels and likely to retest 1450 and beyond levels. Entry around 1407


PIDILITE INDUSTRIE is in triangle pattern, short term Target 420PIDILITE INDUSTRIE is in triangle pattern, short term Target 420. If triangle breaks in upside big up move towards 1500 possible.
NSE:PIDILITIND


Pidilite just broke an important trend line.Important trend broken with an inverted triple top formation


pidlite breakout (wacth out for 1458 levels see some resistance)See resistance on 1458 levels 50 % retracement level. wait for a correction towards 1440 levels before going long.With a stoploss at 1434 go long.
Pivots ascending higher.
Pidilite Industries Ltd. - DAILY CHART VIEW!!#PIDILITIND
Pidilite Industries Ltd. has broken out of important level of resistance, RSI 50+ & surging
If the stock can give weekly close above 1450 & then sustain above , it can eventually move towards 1530,1580 & 1710.
THIS IS MY GENERAL VIEW OF THE SCRIPT. FOR COMPLETE STOCK ANALYSIS, INTRADAY LEVELS AND FOLLOW-UP.
CONTACT ME!!

Breakout for PidilitePidilite just has a breakout for the triangular pattern. Might go high. Target 1 & 2.

[Positional] Pidilite Breakout Wedge!!Buy with stop loss.
Looks bullish for 1550+
"Cut your losses , cut your losses , cut your losses. Then may be you have a chance.
~ Ed Seykota

PIDILITIND forms parallel channel Trend is down so expecting price to give breakdown. Go short once support line is breached and get confirmation
If it takes support go for long but with less target of profit as trend is down
Disclaimer: Analysis in charts are only for educational and information purpose only. Invest or Trade at your own risk management.
PIDILITE : PRICE STUCK LIKE FEVICOL BELOW THE BALANCE LINEI find Balance Line chart a easy and fast way to gauge the performance of a stock in relation to itself. Pidilite has been consolidating for a long time now except for the spike between Jan to Mar 2020 the brief green area on the chart.

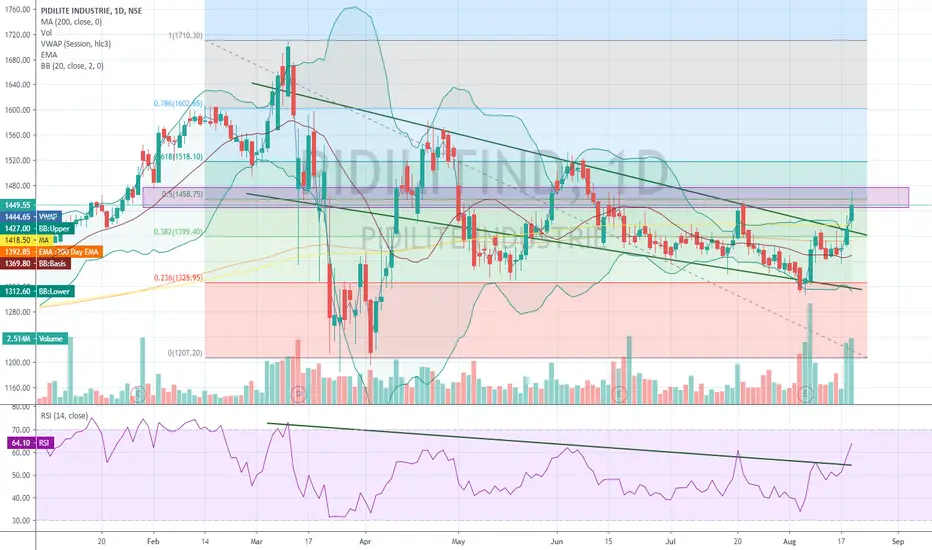
SWING TRADE #1 PIDILITE IND.Consolidating at 38.2% retracement level, crossed above level, also hammer at the bottom seems bullish indication, crossed 20 days ema but still below 200 days ema.
looks bullish on chart and can be considered as swing trade.
important levels are
entry range : 1380-1390
stop loss : 1360-1365
target :
first : 1450
second : 1490-1500
