Trade ideas

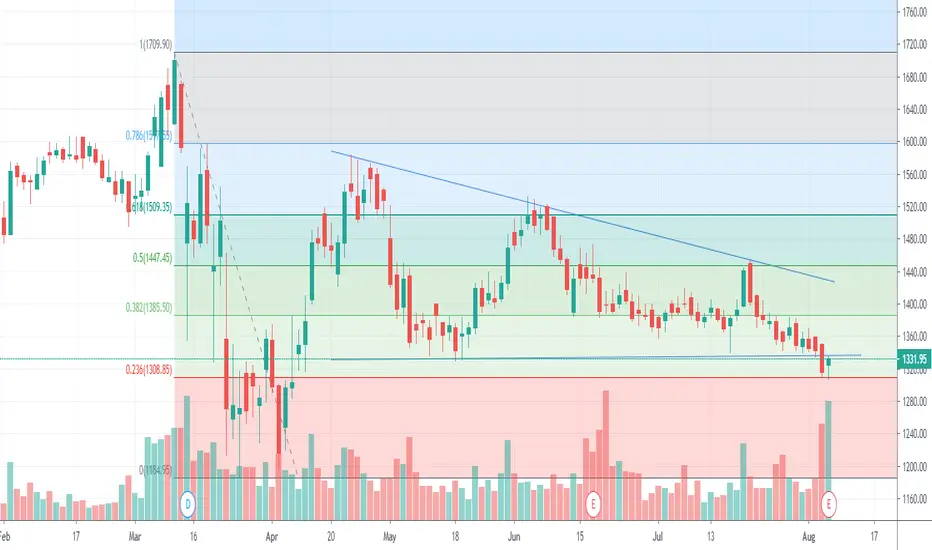
pidililite long position1) daily candle hammer formed
2)fibonacci retracement 23.6% support
3) high volume and delivery
T1 1380, T2 1440
pidilite industries based on harmonic levelsShort and long levels are marked clearly based on harmonics, if the C levels are not broken this patterns are valid.


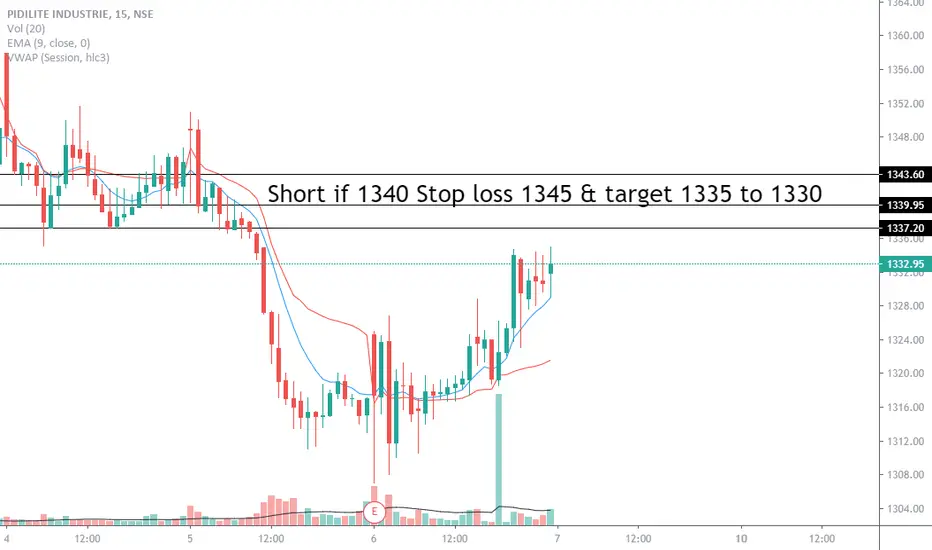
pidlitind 15 minIn previous 1hour chart 1340 to 1345 is support but now support is break and possibility is support becomes resistance so all the details in chart

PIDILITIND COMING AT SUPPORT AREA.IN PIDILITIND LITTLE BIT DOWNFALL REMAIN 80 TO 70 POINTS AND STOCK IS COMING AT SUPPORT AREA INVESTOR WHO ARE LOOKING FOR INVESTMENT THEY CAN PLAN I MIGHT BE LOVE TO ADD MORE AT THIS AREA MAKE YOUR PLAN ACCORDING.


Pidilite Industries - Positional Call #1Triangle Breakout and strong support at the lower end. Likely to move upwards in a parallel channel if support level stays strong.
Analysis only for educational purposes.

Descending Pidilite, Increasing !Stock in a descending channel pattern but Rsi has picked up at the support level and stock can attempt a minor pullback on the upside.

Pidilite Industries LtdBuy signal generated on Pidilite industries
Entry Point 1328
Target 1440
Happy Trading!!


