Double Symmetrical Breakout for Swing Hey Guys,
Go Long only after trend confirmation. Today it gave a triangle breakout
Pidilite has formed a symmetrical triangle pattern twice and broke both the patterns.
Points to consider.
1. RSI crossed 60 good for going long side.
2. We got a good volume break out today.
3. Strong trend line support.
4. MACD crossover.
5. OI is Built upon the long side.
#Trade as per your appetite. Do your own analysis before taking the trade.
Stay tuned for updates
Trade ideas
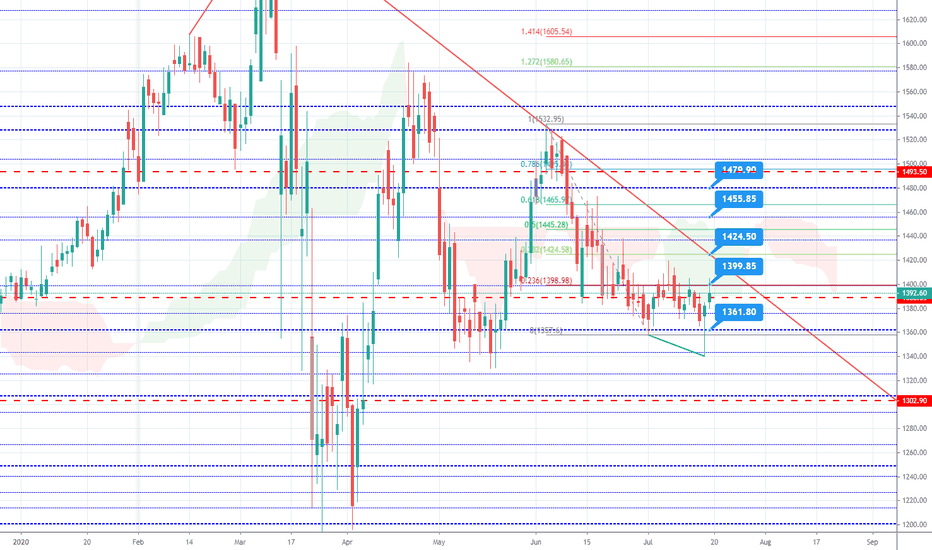
PIDILITIND, BREAKOUT POST 4 MONTHS (CHART# 297)PIDILITIND has given bullish breakout along with good volume today from a trend line which is running from March'20.
Above 1445 this should be a good momentum for long run.
Kindly track NIFTY as well to ensure we have trend along with us which will further increase our probability of setup. A simple price action study of NIFTY suggest along with Fibonacci that 11100- 11150 is strong resistance area and till then we can have this bull run.
FOR MORE INTRADAY RECOMMENDATIONS & CHARTS REACH OUT.
Price action trading is a process of using price to analyze stock possible movement. Keep your charts as simple as possible so that you keep focus on most important element on chart "PRICE".
If you receive any benefit from idea, appreciate by your likes/comment. If you earn from my ideas, kindly consider donating small part of your profits to those in need.
Reach out if you wish to learn simplest form of price action and willing to put effort in practice.
Watchout my previous ideas to understand how easy it is to understand price action and earn from it.
Cheers!
Piyush Gupta
Pidilite - Stick to it - LONGProfits will stick to those who stick to Pidilite. Afterall, the company manufactures Fevicol!. The Price action has an almost perfect setup for going long - double bottom, consolidation, a nice rejection candle with a long tail. Technical indicators are positive too - RSI Bullish Divergence among other indications. The blue horizontal lines are Gann Levels - an indicator that I published and use extensively for finding S/R levels. Will go long above !400. There is a trend line resistance at 1424.5 which is also a key level for W confirmation. Targets are 1456 and 1480
Synergistic Pattern: Advance (W+Flag) + Support on EMA 300Levels are mentioned on chart for Swing trading.
Please check the description section for early entry level in given stock to get better Risk to Reward ratio.
Kindly like & share this pattern. Comment with what do you think.
Follow me @ tradingview for more updates!!!
Early entry: 1400
SL: 1340
Target: 1590
RR: 3.16
Thank you. Happy Trading!!!
Best Regards,
Dr. Shamraja Nadar,
PhD in Technology.
Disclaimer
--------------------------------------------------------
All investments involve risk, and the past performance of a security, industry, sector, market, financial product, trading strategy, or individual’s trading does not guarantee future results or returns. Investors are fully responsible for any investment decisions they make. Such decisions should be based solely on an evaluation of their financial circumstances, investment objectives, risk tolerance, and liquidity needs.
---------------------------------------------------------
Pidilite Indicating fresh Buying opportunity (Long Positional)After long consolidation, Pidilite is looking decent at these levels and hopes that the stock might test its previous swings as indicated in the chart. Act on the levels as indicated in the chart with proper entry rules and SL as indicated with proper risk management. The above levels are cash levels and for positional purpose only.
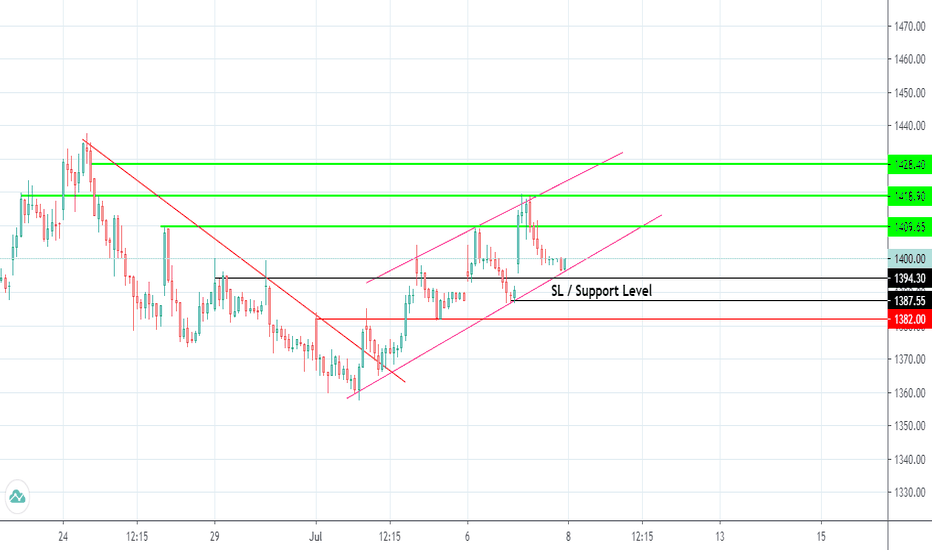
Pidilite 08-07-2020 Intraday/Swing trade setup Pidilite is on Bullish trend as of now.
Moving with in ascending channel pattern , if tomorrow will on same momentum than only this setup will work.
Targets
T1-1407-1409
T2-1415-1418
T2-1425-1428
Invalid below support level which is 1395-1385 (SL for Swing trade).
PIDILITIND Swing Trading!! swing trading !!
!! follow 1:3 Risk Reward Ratio and 2% Rule !!
!! please note trade with caution and manage your risk !!
!! all views for educational purpose, trade at your own risk !!
Request you all to LIKE and COMMENT on views as then I come to know that how much engagement on the post.
Paypal donation - paypal.me/shubhamkhan


