PIDILITIND - DOES IT LOOK LIKE CUP & HANDLE + TRIANGLE BREAKOUT?NSE:PIDILITIND
NO NEED TO MENTION ABOUT THE LEVELS.
SUPPORTED BY TRIANGLE BREAKOUT.
MAKES IT MORE CONFIDENT.
ONE OF THE POPULAR PATTERNS.
ONLY FOR EDUCATIONAL PURPOSE.
Trade ideas


PIDILITE INDUSTRIES Trading SetupDisclaimer: All charts are purely for educational and information purpose only. Invest or Trade at your own risk.

PIDILITINDBuy PIDILITIND above 1520 for the Targets of 1670, 1800 and 2000....
.......
Stoploss 1300....
.........


pidilite india dont know what will happen, but most probably it will walk into parallel channel. trade accordingly
consult your financial advisor before taking trade


PIDILITE forming a perfect symmetrical triangle on the daily TF.Cab be a good long opportunity considering the prior uptrend, contracting volume during the formation and the price respecting the symmetrical triangle boundaries religiously. One of the apprehensions with this chart is that the price seems to have gone too deep into the apex of the triangle, which negates the view.
Further, If it so happens, that the breakout is towards the lower boundary of the triangle, this can be a short opportunity then, and can result in the reversal of the prior uptrend of the stock.

PIDILITE INDUSTRIES Trading SetupDisclaimer: All charts are purely for educational and information purpose only. Invest or Trade at your own risk.

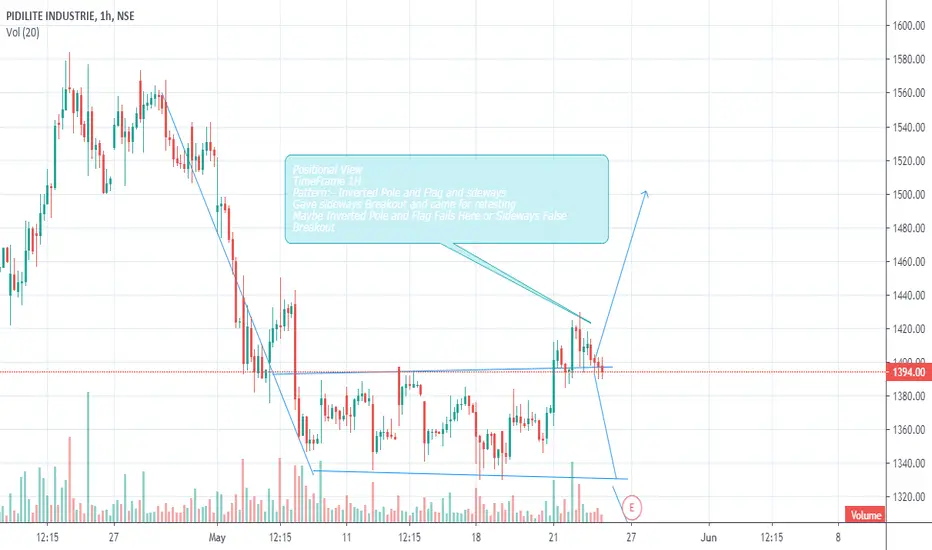
PidilitInd Short Term ViewPositional View
TimeFrame 1H
Pattern:- Inverted Pole and Flag and sdeways
Gave sideways Breakout and came for retesting
Maybe Inverted Pole and Flag Fails Here or Sideways False Breakout
A must have Portfolio Stock !!Pidilite hasn't crossed 200 EMA on a weekly chart since 2009.
We have 3 different support lines to warn us before taking an exit.
The stock has a record of not crossing the 200 EMA for more than 10 years now.
You can accumulate more quantity near the trend line or just invest & forget.

PIDILITE INDUSTRIES IdeaDetails added in Chart.
Disclaimer - Please do your own analysis before initiating the trade.

pidilite short termIn the morning it breaks its resistance 1434
if it breaks again that level it will retest the 1434
and we can go buy side only if breaks todays high 1445
with sl of 1420
for 1490 1st target
2 nd 1528
3 rd 1549
i took very aggressive entry at 1428 ( ON MY OWN RISK )
with sl of 1420
DO YOUR STUDY BEFORE TAKING THE TRADE


Positional Trade in PIDILITE1380-1390 is a strong demand zone. Once it will manage to trade above 1340 then it may test next supply zones as per the chart...


Is Double Breakout Signal > 200 EMA ?Pidilite gave 2 confirmation for a breakout on 2 different Trend lines with Volumes and RSI rising.
This could very well be a false signal and trap buyers in intraday as the stock closed below touching 200 EMA.
Crossing it will activate the trade. Until then it's bearish.
Levels are given on the chart.
Stay Safe & Trade Safely. :)


PidiliteStock is facing resistance around its 200 SMA on daily chart. It is trading below its key moving averages. Expect it to go below 1200 in a medium term. View negated if breached 1450

How Support and Resistance of Fibonacci Levels - Pidilite IndJust posted chart for learning purpose, please note the retracements levels bounce from key levels.
How stock behaves at key levels marked to form price action on downside when the latest swing was marked using fibonacci retracement
After Forming W Pattern at bottom, confirming through RSI Divergence,
1) First Retracement to 38.2% levels, then came down
2) again found resistance at 38.2% levels
3) third time broke 38.2% level as it got weak and got resistance at 61.8% level
4) Retraced to 50% level and bounced back to break 61.8% level (perfect price action)
5) Formed double top pattern at 78.6%
6) stock fall downside back to 38.2% levels and retraced to 50% levels (perfect price action)
7) Again retracing and finding resistance at 38.2% level
Happy Learning

