Pidilite LongNSE:PIDILITIND
~ Stock trading above 30 Week EMA
~ Consolidating since Nov,22
~ Down trendline BO and retested
~ RS -ve but uptrending & RSI > 50
~ FIB Retracement done till 61.8%
Fundamentals -
* EPS QOQ increasing
* EPS YOY increasing by 68%
* Sales YOY Increasing by 4.4%
* Annual EPS Growth 42% TTM
* FII & DII increasing stakes
* ROE - 20.3%, ROCE - 25.8%
T1 - 3317, T2 - 3827
This is for educational purpose. Do your own study before investing.
Trade ideas

Pidilite - LongPidilite is making triangle and can each 2630,2700. Also a head and shoulder pattern is seen so it can make 300 point upmove if market supports.

Bet on Pidilite Industries LtdThere is no guarantee in stock market and Nothing over week
Always Invest or trade according to your loss bearing capacity
Bet on Pidilite Industries Ltd
Target: RS 2820
CMP: RS 2715.10
STOP LOSS: RS 2600
Disclaimer: I am not Sebi Registered.


PIDILITE Looks good BSE:PIDI1!
Best trade if pidilite maintain bullish momentum on monday
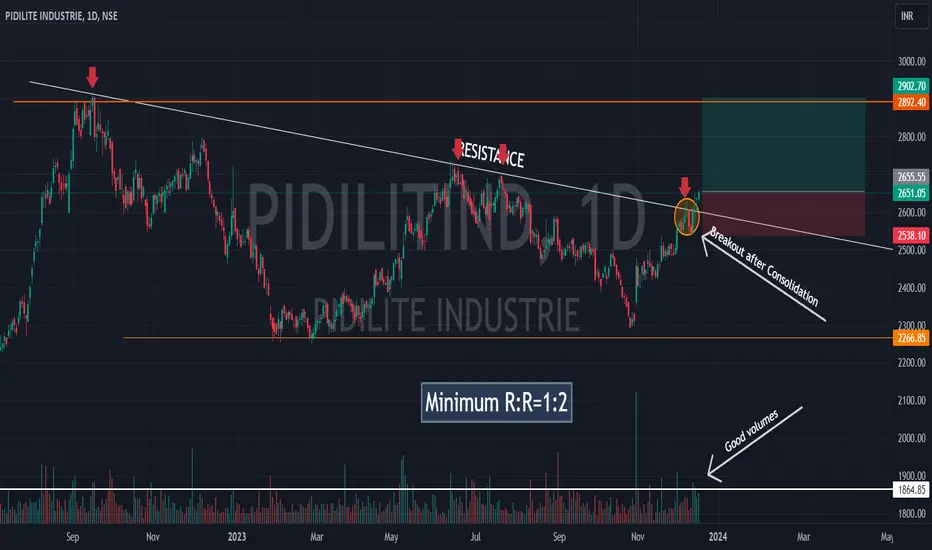
Minimum R:R = 1:2
Trendline Breakout after 1 year , looking good fore swing trade
I m not sebi registered , take trade at your own risk
Thanks
PIDILITIND - Weekly AnalysisIn the Weekly Chart of PIDILITIND ,
we can see that, it has given trendline breakout.
Let it retest and the enter with SL and target.
Expected momentum is shown in chart.

Breakout, Ready For Another 20% Rally Symmetrical Triangle Pattern: Indicates a potential continuation of the previous trend, suggesting a bullish breakout.
Long-Range Accumulation: Prolonged accumulation often precedes a strong upward move, reflecting increasing investor interest and potential buying pressure.
Higher Highs-Higher Lows Formation (HH-HL): Reflects an overall uptrend, reinforcing the bullish sentiment in the market.
Huge Volume Buildup Near Breakout Zone: Significant volume surge near the breakout level implies increased market participation, supporting the likelihood of a sustained upward move.
Considering these factors, a long position seems favorable and target should be 3200 area which is almost 20% from here , but it's crucial to monitor the breakout confirmation and implement proper risk management strategies.

Trend line breakout in Pidilite Consolidation in a range from long time.
Trendline broken out and a good bullish close above trendline. Stock seems ready for upmove. Though it alis a slow mover.

#Pidilite cash : Looks good above 2633.10#Pidilite cash - Positional call
12.12.2023
Looks good above 2633.10
& add more above 2660.10
Stoploss at 2590
Tgt 2730-2740/2840
Cmp 2608.50

Inverted Head and Shoulder - PidiliteInverted or bullish Head and shoulder formed in Pidilite Industries.
Bullish Engulfing is the only candlestick pattern that can be used for continuation pattern.
Waiting to pierce the high of the previous bullish candle.
At current scenario we are not sure that this classic Head and shoulder pattern will achieve their target because because there is an immediate and strong downtrend line is placed above.
Volume is also low at the current level so we are not getting confirmation from volume.
RSI is placed about 60 which is the healthy signal for price may make higher upside in coming days.

Pidilite Industries, Target 2700 - 3200Pidilite Industries has given long trendline breakout and is moving towards
completing rounding bottom pattern, with some major resistance on the way
which if breached can reach higher targets.

PIDILITE looks good for long term investment.Pidilite, a consistently expanding stock, underwent a corrective phase over the past two years. However, there are compelling signs suggesting that this correction is now reaching its conclusion. The current market conditions present an opportune moment to consider acquiring Pidilite, as it appears to be poised for potential growth following the recent correction.

Inverse Head and Shoulder in PidiliteSeems forming of inverse Head and Shoulder Pattern in Pidilite
also todays candle indicates bullish move in uptrend

pidilite ind-long price action with volume -price crossing 18 day EMA and IB formation above 18 EMA
18 day EMA defended till date
bullish engulfing pattern crossing 3 day low and 50 day EMA
target -2600
stoploss marked

Pidilite- a fevicol company 1. Pidilite trendline breakout
2. An inverse head and shoulder formation
3. Breakout of H&S and now again resting at levels.
good risk and reward

Pidilite Long SetupThere is a wonderful setup to go long in Pidilite.
Beautiful consolidation - wait for breakout

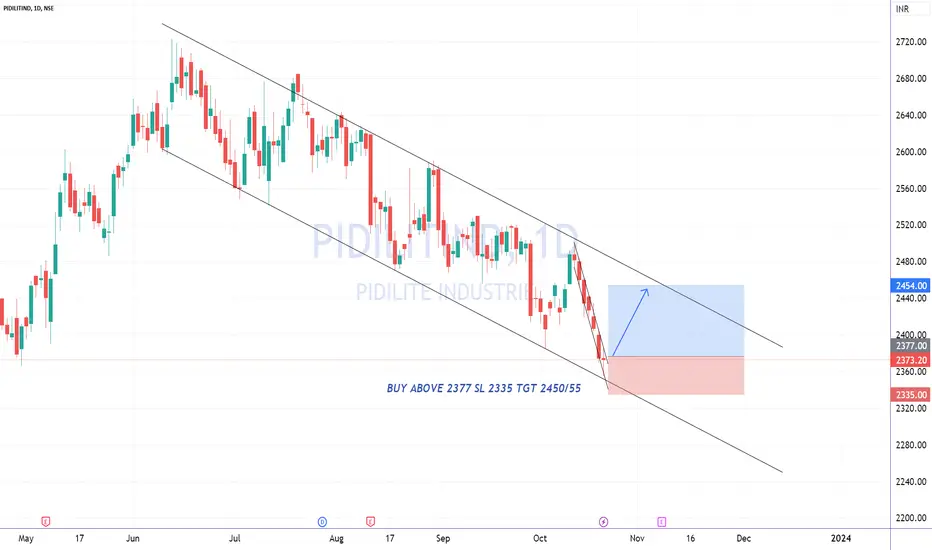
PIDILITIND AT CHANNEL WITHIN THE CHANNEL BREAKOUT YET TO CONFORMChannel within the Channel Breakout yet to conform ........BUY ABOVE 2377 SL 2335 TGT 2450/55
Pidilite Support Based TradeLooks Good on weekly Time Frame.
Chart Is self explanatory.
Target and Stop Loss are On the chart.
Not a call/ Tip video.
Just for knowledge.

#Pidilite ind cash : Looks good above 2502.10#Pidilite ind cash -
Positional call for 4 days
11.10.2023
Looks good above 2502.10
Stoploss 2470
Tgt 2528-30/2570/2600
Cmp 2487

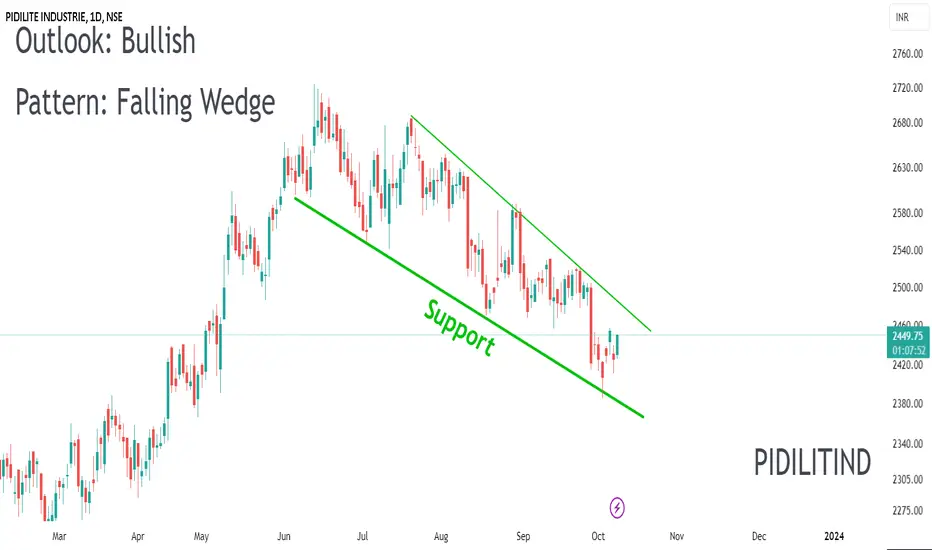
📈 Exciting Bullish Pattern Alert! 🐂📈 Exciting Bullish Pattern Alert! 🐂
📊 Pattern: Falling wedge
📌 Symbol/Asset: PIDILITIND
🔍 Description: Stock is going down in falling wedge after a uptrend. We might see huge upside once resistance is broken.
👉 Disclosure: We are not SEBI registered analysts, this is not a buy or sell recommendation. Technical patterns are just one piece of the puzzle. Consider conducting further research, consulting with a financial advisor, and managing your risks appropriately.
Crude benifit themeOne can invest in this monopoly stock
Medium term stoploss 2350 only it's potential is ath easily in 1 month

Pidilite Industries swing tradePidilite Industries swing trade for risk reward ratio of 1.25
can look for tp of 2544 only above 2500 with stop of 2460
DC : only for educational purpose

PIDILITIND Swing TradeHi all - swing trade opportunity to go long for PIDILITIND.
Key Highlights:
1. Consolidating in range, enter long on breakout
2. Good risk and reward opportunity
