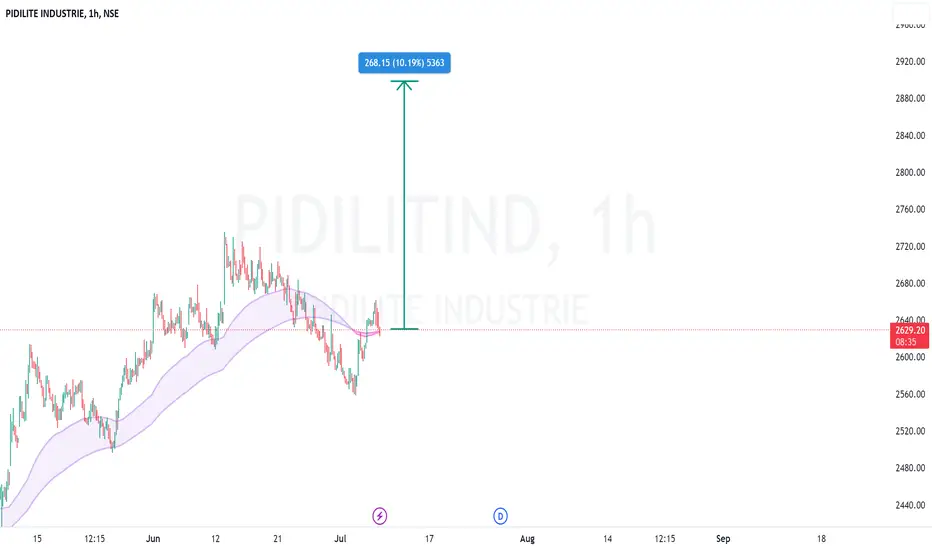
PIDILITINDPIDILITIND:- Symmetrical triangle pattern has formed, keep an eye on the stock
Hello traders,
As always, simple and neat charts so everyone can understand and not make it too complicated.
rest details mentioned in the chart.
will be posting more such ideas like this. Until that, like share and follow :)
check my other ideas to get to know about all the successful trades based on price action.
Thanks,
Ajay.
keep learning and keep earning.
Trade ideas

PIDLITIND no more downside left,start accumulating for target 3kPIDLITIND nearing its 3 years confluence support.
It should consolidate or reverse anytime in couple of weeks. So start initial position and add more once reversal is confirmed above 2520

Pidilite Industries - Long, Very Bullish
Levels going further from here have already been provided in the previous discussion on this stock. Link provided.
Please execute properly with levels to watch as mentioned. If level is maintained tomorrow, nothing to worry, else wait for Monday.
Thank you

Piddilite - Live Market Analysis
Please adhere to disciplined trading. Let the levels come then execute. Check my previous discussion on this stock. Link provided.

Piddilite - Daily Chart
Has formed a strong trend line and make ABC- ABC waves marked by triangles. Long above 2517 with SL of 2503. Please refer to my previous coverage on the stock. Link provided.
Don't be in haste. Please wait for the levels to come. Buy only that many of stocks which you can manage.

Piddilite Industries = Perfect Entry above 2489
Resistances have become support. Trend Line drawn has stabilized. All the levels have been marked on 1H chart. Play safely between golden circles drawn.
Have patience in execution. Find reasons to enter into the trade. Assess and reassess the reasons to trade and if found valid, give a go without hesitation.
I am not a SEBI Registered Analyst. Please consult your financial advisor before making a decision.
Let you grow. May! I follow you.

Pidilite Pidilite nearing key fib retracement and EW counts shows correction about to complete. if any error on counts do comment for correction

PIDILITE TREND LINE RESISTANCE BREAKOUTPIDILITE breking a trendline resistance
good volume MACD crossover
2730 can be target
breaking 20 ema
educational idea only

Long Pidilite IndustriesPidilite Industries (Recent Underperformer) can give a new upswing move with a good 1:3 risk:reward. A good OI Buildup at 2500 levels can give a good support to the new swing. Long Above 2540. Targets Mentioned in chart

PIDILIGHT INDUSTRY CHART analysisPIDILIGHT INDUSTRY Target is 3291 but taking a months/year. this is also long tern stock because of there are no other company in such field.
If you opportunity to buy in 2400-2450 range can you put GTT order.
Short term target is 2850.
SL 2540
Note: Fundamentally company is good
This is only educational purpose

FEVICOL KA SUPPORT STRONG HAIPIDILITE is trading near its very strong support (jisko fevicol support bol saktey hai) of 2585, this 3rd time it took support @ these level.
If it font dont break 2585 today then its a triple bottom on these levels.
Could be bought here with stoploss below 2585 & firts target of 2630 & if it sustains above it then 2730 2nd target.

Cup and handle in PidiliteBreakout has already happened forming a very nice CNH Pattern
Considering 7% target from handle tip 2940 is first target from here(ATH is 2913). Fib is also showing target of 2980. So this makes a confluence target of many theories.
Lets see how far we go

pidilite - sell on risesell from cmp to 2684
sl close above 2686.2
easy tg - 2655
tg2 - 2640
Disclaimer : This is my personal analysis for study purpose not intended for trading.

Triangle pattern breakout in PIDILITINDPIDILITE INDUSTRIES LTD
Key highlights: 💡⚡
✅On 1Hour Time Frame Stock Showing Breakout of triangle Pattern .
✅ Strong Bullish Candlestick Form on this timeframe.
✅It can give movement up to the Breakout target of 2725+.
✅Can Go short in this stock by placing a stop loss below 2610-.

pidilitind- short bearish IB formation below the pivot line
price RIS MACD divergence
3-6MACD below zero
12-26 MACD negative crossover


PIDILITE - SWING TRADEMissed opportunity to buy Pidilite at 2608, buying at current CMP and will try to average at 200 EMA as well.
It will make new ATH high.
High probability trade
PIDILITE to take long entryLong PIDILITE above 2620. Add the stock to your watch list. Good risk to reward trade. The stock has taken the support of 50 EMA levels. A very high probability that stock will turn up. This is for your educational purpose only.

Buying Criteria01. Relative strength of the stock is above nifty @period 123,
02. Relative strength index above 55 and
03. Average directional index (ADX) crosses 25


PIDILITE is Hourly Buy for 150 Rupee UpsidePIDILITE is Buy on hourly charts for Target 2650-2680in 1 Weeks time.
LTP - 2568
SL - 2535
Target - 2650-2680
Time Frame -5/6 Days

PIDILITE Hourly Buy Flag Pattern formationPIDILITE Hourly Buy based on Flag Pattern....
LTP 2552
SL - 2510
TARGETS - 2700+

SELL due to Breakout FailureScrip is on verge of Breakout Failure and reversed before touching strong Resistance which shows the weakness.
Scrip moved upside with multiple swings which shows good strength.
At any point if Daily Support breaks, NO MERCY slogan will murmur in MARKET.
We can hold positional SELL for Target located as per Half Bat pattern & Cypher Pattern.
