Pidilite Cmp 2351 dated 6-3-2023 Rectangle BOPidilite Cmp 2351 dated 6-3-2023
1. Rectangle Consolidation
2. BO above 2355
Buy above 2355 for target 2380-2425-2440-2460 SL 2300
Disclaimer :
I am not a SEBI registered Analyst so please do your own Analysis before taking any action.
The above view is shared just for educational purpose.
By no means shall be responsible for any losses amounting out of it incase if any trades on it.
It is just a view, please trade at your own risk.
Trade ideas


Pidilite Industries - Short Candidate - Broken Imp SupportAccording to price action, NSE:PIDILITIND is showing signs of exhaustion and weakness. Reasons why I think this is a short candidate -
1) Both the Daily and Weekly candles appear to be weak.
2) Future OI has been unwinding long for the last 5 days, and there was short build up in this stock today as well.
3) DTF has formed a bearish marubozu candle.
4) For the targets shown on the chart, one can short with a stop loss of 2560. If the candle closes below 2381 on any given day, expect 2200 in the coming sessions, which would be a good base to go long in this stock.
Let's see how the story develops. Best wishes!
Disclaimer -
- The opinions expressed here are my own. This is for my own records as well as what I see on charts.
- If you are referring to this, please keep in mind that it is only for educational and research purposes.
- Past performance is no guarantee of future results.
- You must accept responsibility for any decision you make. DO NOT TAKE THIS AS AN INVESTMENT RECOMMENDATION.
- It's your hard-earned cash. Trade / Invest wisely, keeping in mind your trading style, goals and objectives, time horizon, and risk tolerance.
- Before investing, conduct your own research and consult with a financial advisor.
TIA!

PIDILITIND SERIES OF BEARISH FLAGS !!!!Chart patterns look apt for a short trade in Pidilite industries
REASONS
1. PIDILITIND from September 2022 has been in Downtrend forming lower highs and lower lows
2. Currently it is ,at its 3rd BEARISH FLAG pattern (gave breakdown with volume spike)
3. Previous 2 Bearish flags achieved their targets(as per pattern-pole length) without any sluggishness
4. There is DEMAND ZONE down near 2100 levels
5. SL as shown @ chart
6. Target - 2140, 2100(trail the SL)
7. Lower low formed on Friday(24 Feb) increases the probability of our short trade
Let's wait and watch how it moves!!!!
NOTE- Just Sharing my view...not a tip nor advice!!!

Good positional opportunityThe stock has been holding its support levels for last 3 weeks. One can buy above 2354 level (positional trades to be taken strictly on day closing levels) for positional 3-5% move.
Learn & Earn,
Dr. Tanya Kumar

Bullish In Pidilight industryBulllish In Pidilight
Entry 2350
sl Entry Candle Low
trg. 2500+
logic, Low shifting On upper Side
making W with Consolidation.

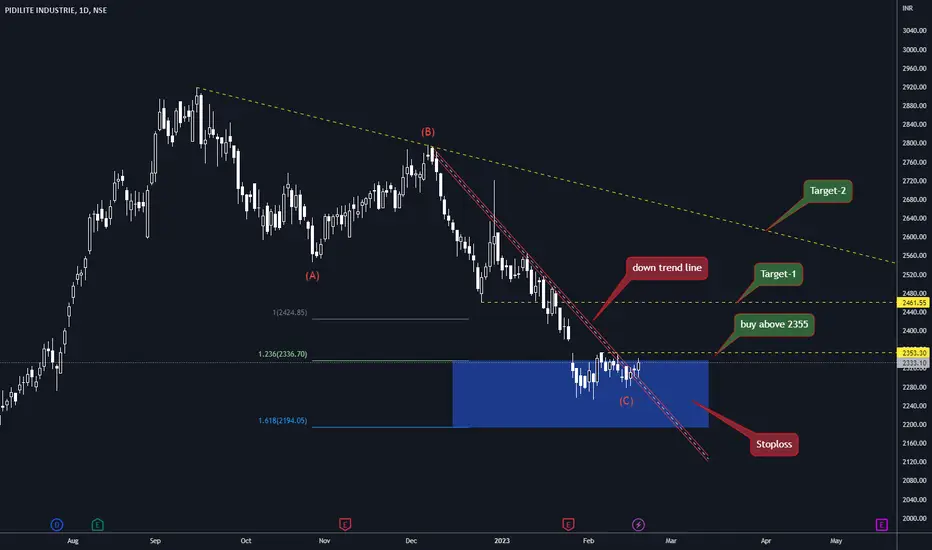
Pidilite industries .... buy setup
This stock(Pidilite industries) seems to have completed the ABC corrective pattern . It seems ready to take off on the upside with the down trend line broken. looking to buy above 2355 for a target of 2460, the second target being the main trend line shown on chart. stoploss for the trade at 2250 ( daily closing basis)
LONG TERM POSITIONAL TRADE INVESTMENTLONG TERM POSITIONAL TRADE INVESTMENT
If you don't have patience, then stay away, you will get a 20 per cent return on investment easily.


PIDILITINDIn the Daily chart of PIDILITIND, we can see that it is taking support at demand zone.
Also, it has mad a Bullish Candle and we can see a recovery by breaking W.
Go Long for for PIDILITIND.

Pidilite - Long Term - HarmonicPotential PRZ of 2200 based on latest retracement and Fib extensions. Also, the Potential Bullish bat pattern shows PRZ in the vicinity of 2200.

PIDILITIND⚡️Even in 2020 fall, it managed to hold its 100-week EMA
Only in 2008-09 did it trade below 100-week EMA.

Pidilite - Bottom Fishing? Pidilite has reached 120 day EMA and Multiyear Trendline support as well - I had pointed it out the last time it did so, and it went on to make 40% returns after that.
This time its different. The company has been showing slowing sales growth, and suffering from increased crude volatility expectations. It reflects in its high PE of 94 against a 10 Year Median PE of 55.
It will be interesting to see if the share price takes support here, or goes on to discount even more to more fair valuations.

Nifty ChemicalsThere is no dedicated chemical stock index in India. This index is made up of top 10 chemicals companies in India. Each having weightage of ₹100 and the base price is set at ₹1000. The base date is 19th January 2023. This index have beaten Nifty in the past but can it beat nifty in next 2-5 years let's see. The index comprises of following 10 stocks.
1.Pidilite
2.SRF
3.Solar Industries
4.Gujarat Fluorochem
5.Linde India
6.Deepak Nitrite
7.Tata Chemicals
8.Atul
9.Navin Fluorine
10.Aarti Industries

Make or break point.PIDILITIND near a 12 year old trendline. Price has been consolidating in the range of 2200 to 2600 around the trend line now for almost 2 years. Usually long consolidations lead to short strong trends. Hence it is at a important positions to study business from various other perspectives including fundamental analysis and cycle analysis.

Bearish Flag in PidiliteBearish Flag formation in Pidilite in lower time frame.
Stock might go down more by 0.7% to 4.5%.

Pidilite - Pattern (Bullish)Pidilite can give short term long opportunity with upto 9% upside move.
Very interesting to see how market behaves.
The above view is just for educational purposes, It's not buying or selling recommendation.

Pidilite - RSI < 30 Currently Pidilite RSI is less than 30, it is in oversold zone, can be studied, it's fundamentally strong stock hence can be added for long term as well
The above view is just for study, It's not buying or selling recommendation.

PIDILITE price movement in an upward channelThe price moves in an upward channel after a correction. In my opinion this could be an ideal stock for swing trade. Please be aware of the supply zone marked in red. If it crosses above it, it could gather good momentum.

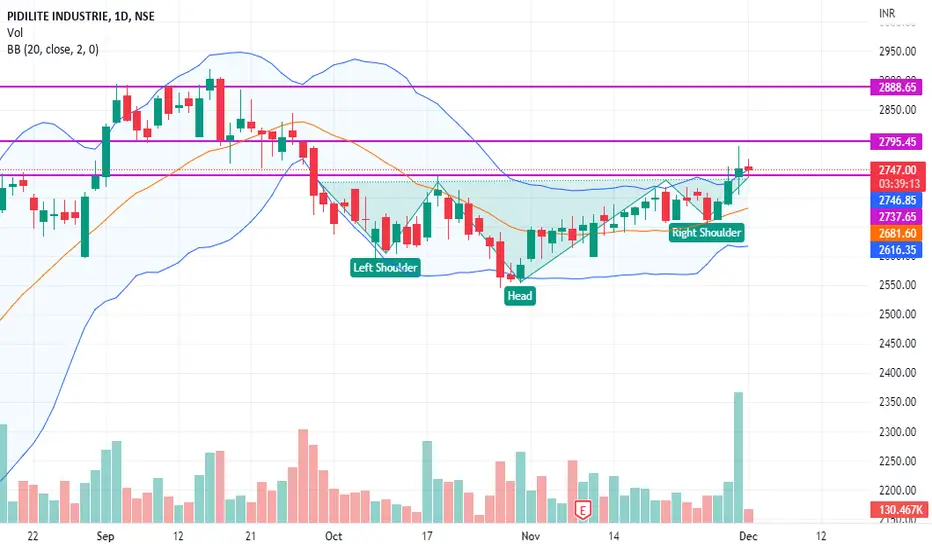
INVERTED HEAD AND SHOULDER BREAKOUT- PIDLITEA great chart pattern breakout has come in this stock. So a very good chances are there that it will move fastly.. Enjoy the trade and maintain risk management..
Pidilite Cmp 2728 dated 29-11-2022 Triangle & RSI BOPidilite Cmp 2728 dated 29-11-2022
1. Ascending Triangle Bo @ 2720.
2. RSI BO
Buy @ Cmp for target 2750-2785-2840-2895
SL 2650
Disclaimer :
I am not a Sebi registered Analyst so please do your own Analysis before taking any action.
The above view is shared just for educational purpose.
By no means shall be responsible for any losses amounting out of it incase if any trades on it.
It is just a view, pls trade at your own risk.

Pidilite Short @2748NSE:PIDILITIND
Short @2748
SL@ 2811
Target 2601
Pidilite is trying for to break supply zone , trading near supply , Short near 2748 or buy put , for the target of 32601 in two weeks.
Disclaimer: author may enter in trade, take your own decision , This is an trading idea not an trading or Investment advice

PIDILITIND PIDILITIND at previous breakout zone which may now act as support.
Keep in watchlist, if hold the level it may bounce.
IF BREAKS DOWN then further weakness may come in.
